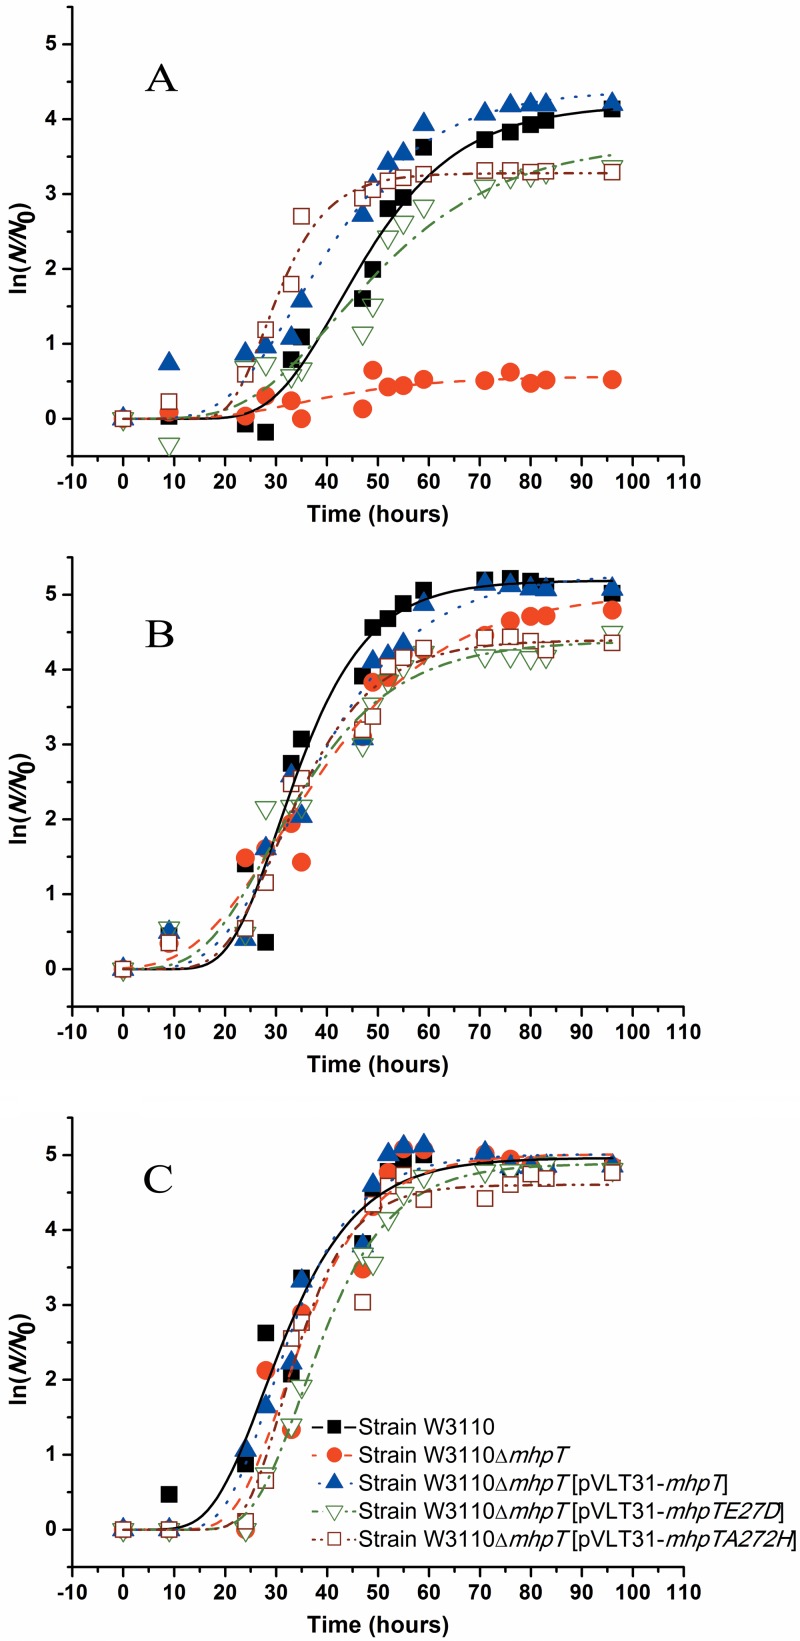
Fig 2.
Growth curves of cells of E. coli K-12 and its variants on 3HPP. Strains were grown with 2 mM 3HPP in MM at 37°C. (A) pH 8.2; (B) pH 7.2; (C) pH 6.2. N, number of cells; N0, initial number of cells. The growth curves were fitted by the modified Gompertz equation (28) with OriginPro (version 8) software, and all points represent the mean values of triplicate trials. The symbol definitions in panel C apply to the curves in both panels A and B.

