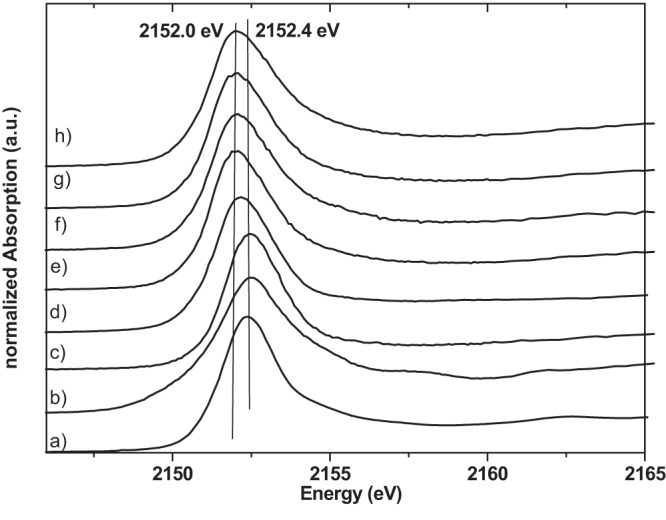
Fig 5.

Phosphorus K-edge XANES spectra of phosphorus reference compounds and bacterial samples. Shown are results for calcium hydrogen phosphate (a), silver phosphate (b), aqueous phosphoric acid (c), ATP (d), E. coli cells not treated with silver (e), E. coli cells treated with silver nitrate (f), S. aureus not treated with silver (g), and S. aureus cells treated with silver nitrate (h). a.u., arbitrary units.
