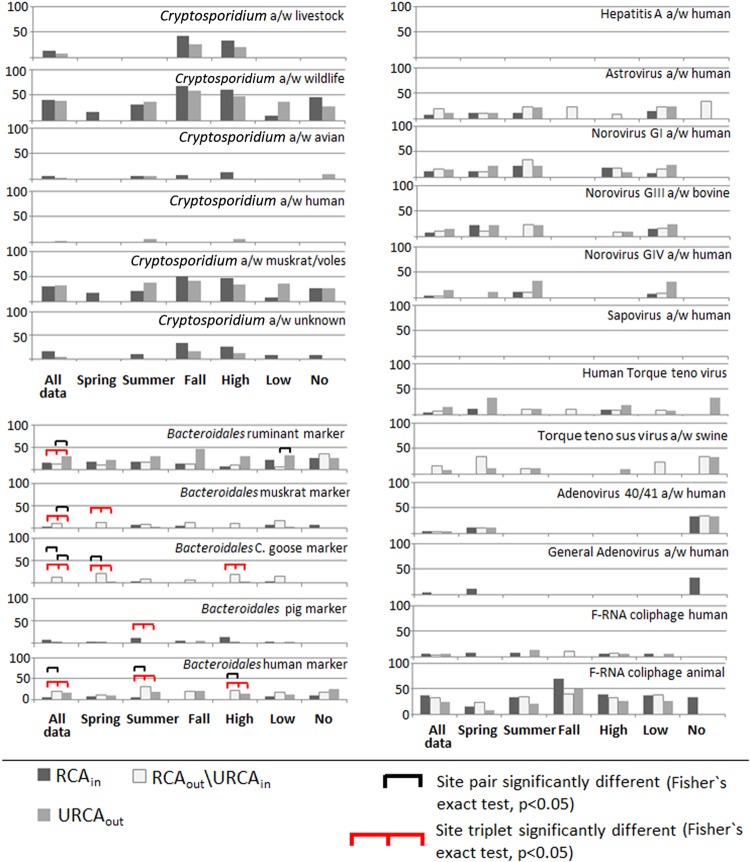
Fig 2.
Percentage of samples positive for microbial source tracking markers by specific site, season, and flow conditions. TCD were used for the RCAin, RCAout\URCAin, and URCAout sites for source markers and source viruses, and the Cryptosporidium-associated source tracking markers at the RCAin and URCAout sites are summarized in a temporally concurrent manner. See Fig. 3 for parasite source occurrence at the RCAout\URCAin site. High flow, ≥0.018 m3 s−1; low flow, ≥0.002 m3 s−1 and <0.018 m3 s−1; and no flow, <0.002 m3 s−1. a/w, associated with.

