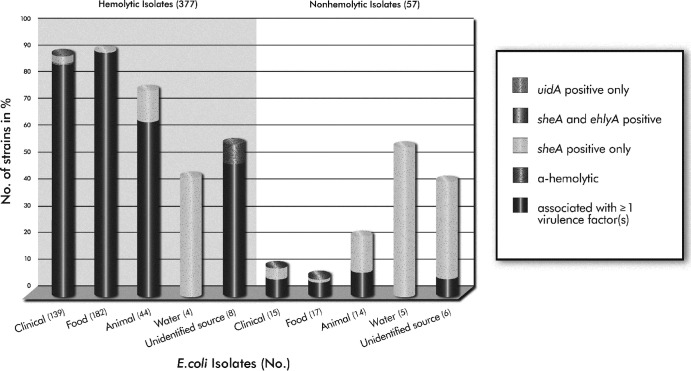
Fig 5.
Proportional distribution of hemolytic and nonhemolytic phenotypes within the different categories of isolates, in relation to the presence of at least one/or no virulence factor (stx1, stx2, eae). Values in parentheses are the total numbers of isolates investigated. (Note: One food isolate failed to grow on SHIBAM.)

