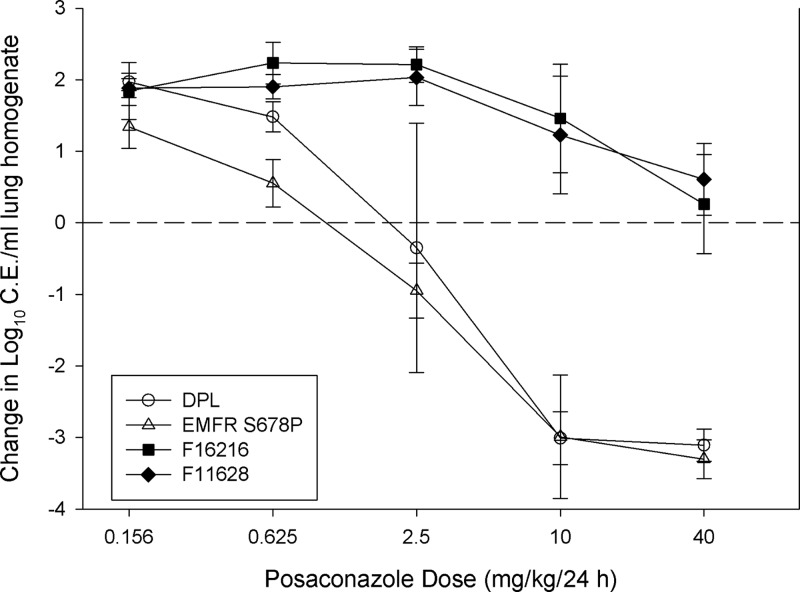
Fig 1.
Posaconazole monotherapy dose-response curves for each isolate. Open symbols represent Cyp51 wild-type organisms, and closed symbols represent Cyp51 mutants. Each data point is the mean (± standard deviation [SD]) log10 CE/ml of lung homogenate for four mice. The horizontal dashed line represents net stasis or infectious burden at the start of therapy. Points above the line represent an increase in burden (i.e., net growth), whereas those below the line represent a decrease in burden.

