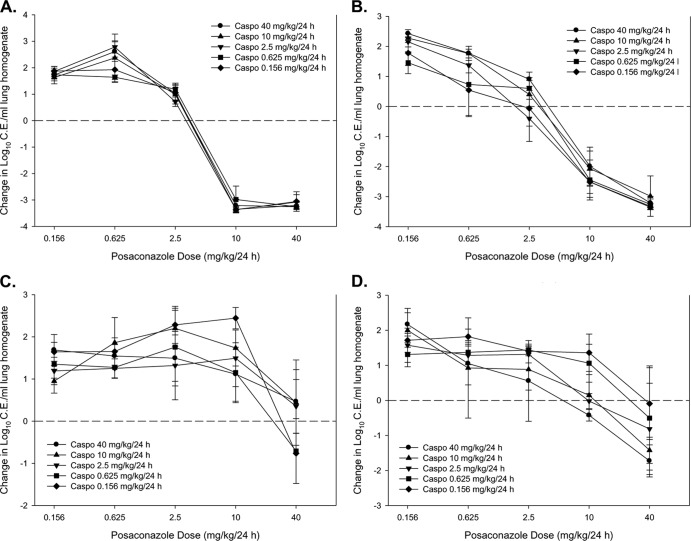
Fig 4.
Dose-response curves for combination posaconazole and caspofungin therapy against isolates DPL (wild type) (A), EMFR S678P (Cyp51 wild type, Fks mutant) (B), F16216 (Cyp51 mutant) (C), and F11628 (Cyp51 mutant) (D). Each graph represents the microbiological effect of varied posaconazole doses (shown on x axis) with addition of each of the 5 dosing regimens of caspofungin (represented by each of the 5 curves). In total, there are 25 different combination data points on each graph. Each data point represents the mean (± SD) log10 CE/ml of lung homogenate for four mice. The horizontal dashed line represents net stasis or infectious burden from the start of therapy. Points above the line represent an increase in burden (i.e., net growth), whereas those below the line represent a decrease in burden.

