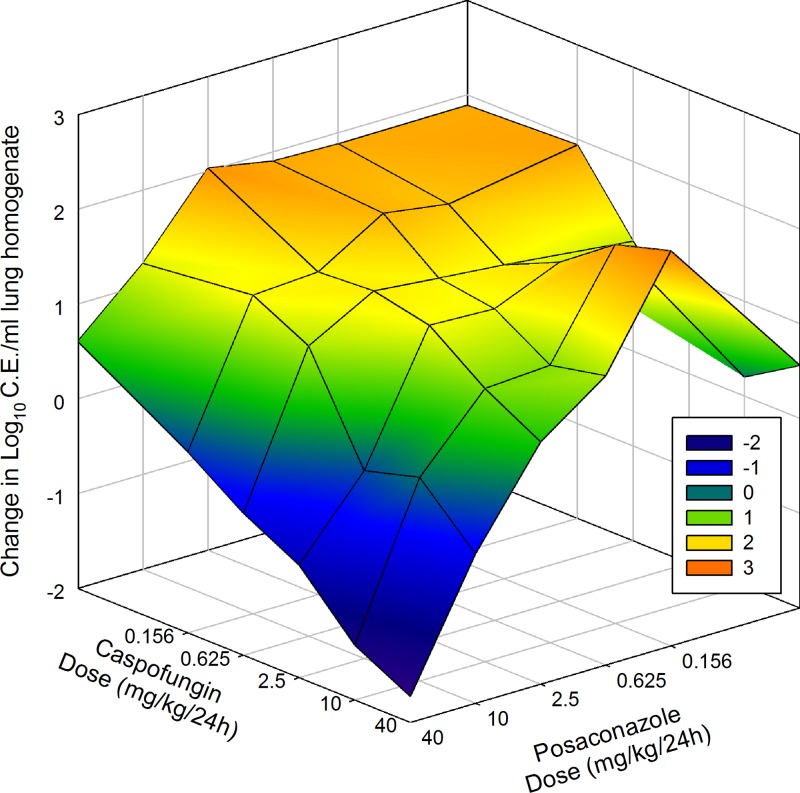
Fig 6.
Three-dimensional surface-response plot of combination posaconazole and caspofungin therapy and microbiological effect against F11628 (Cyp51 mutant; posaconazole MIC = 8 mg/liter). The vertical axis represents the change in burden from the start of therapy. Each data point is the mean change in log10 CE/ml of lung homogenate from four mice. Areas above zero (green, yellow, and orange) represent an increase in burden (i.e., net growth). Areas below zero (blue and dark blue) represent a decrease in burden.

