
Fig 4.
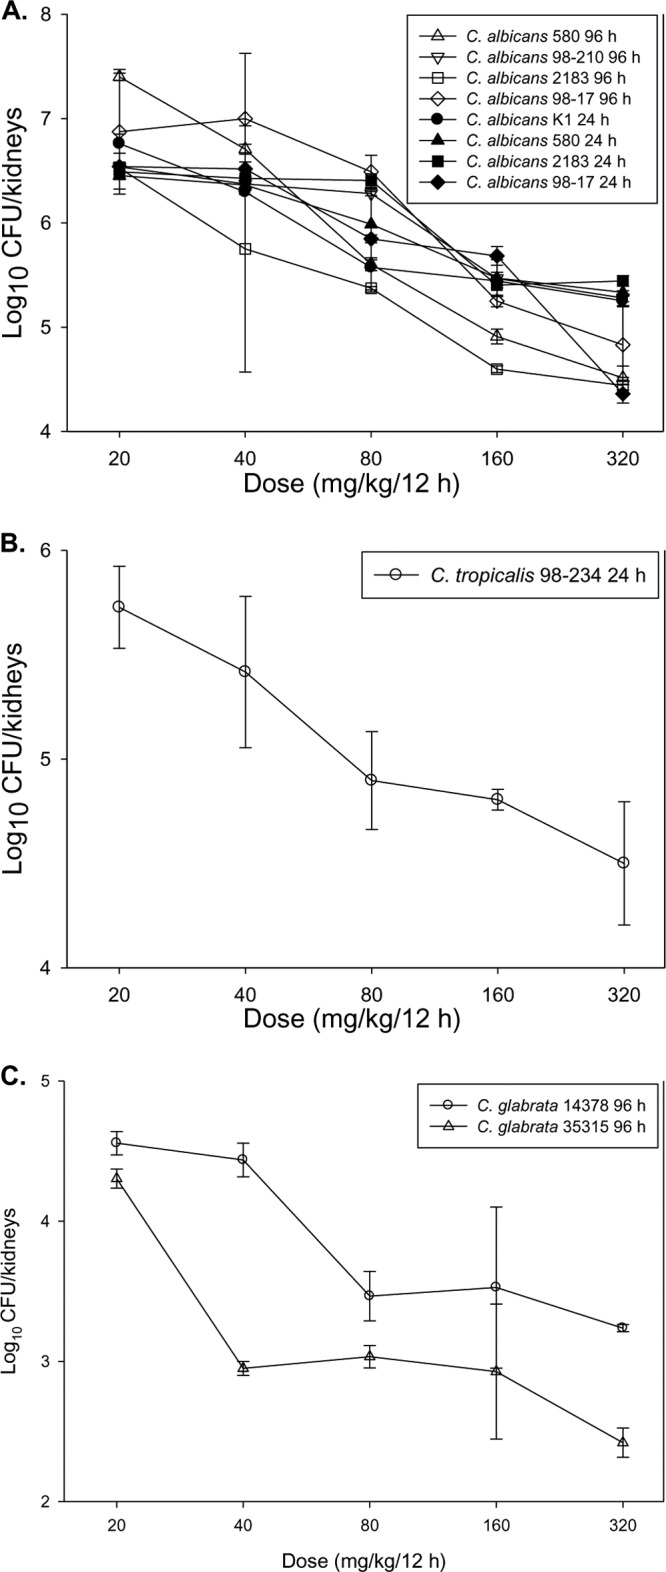
In vivo dose-response curves for 5 C. albicans (A), 1 C. tropicalis (B), and 2 C. glabrata (C) isolates. Each symbol represents the geometric mean of organism burdens in the kidneys of three mice. Error bars, standard deviations.
Official websites use .gov
A
.gov website belongs to an official
government organization in the United States.
Secure .gov websites use HTTPS
A lock (
) or https:// means you've safely
connected to the .gov website. Share sensitive
information only on official, secure websites.
In vivo dose-response curves for 5 C. albicans (A), 1 C. tropicalis (B), and 2 C. glabrata (C) isolates. Each symbol represents the geometric mean of organism burdens in the kidneys of three mice. Error bars, standard deviations.