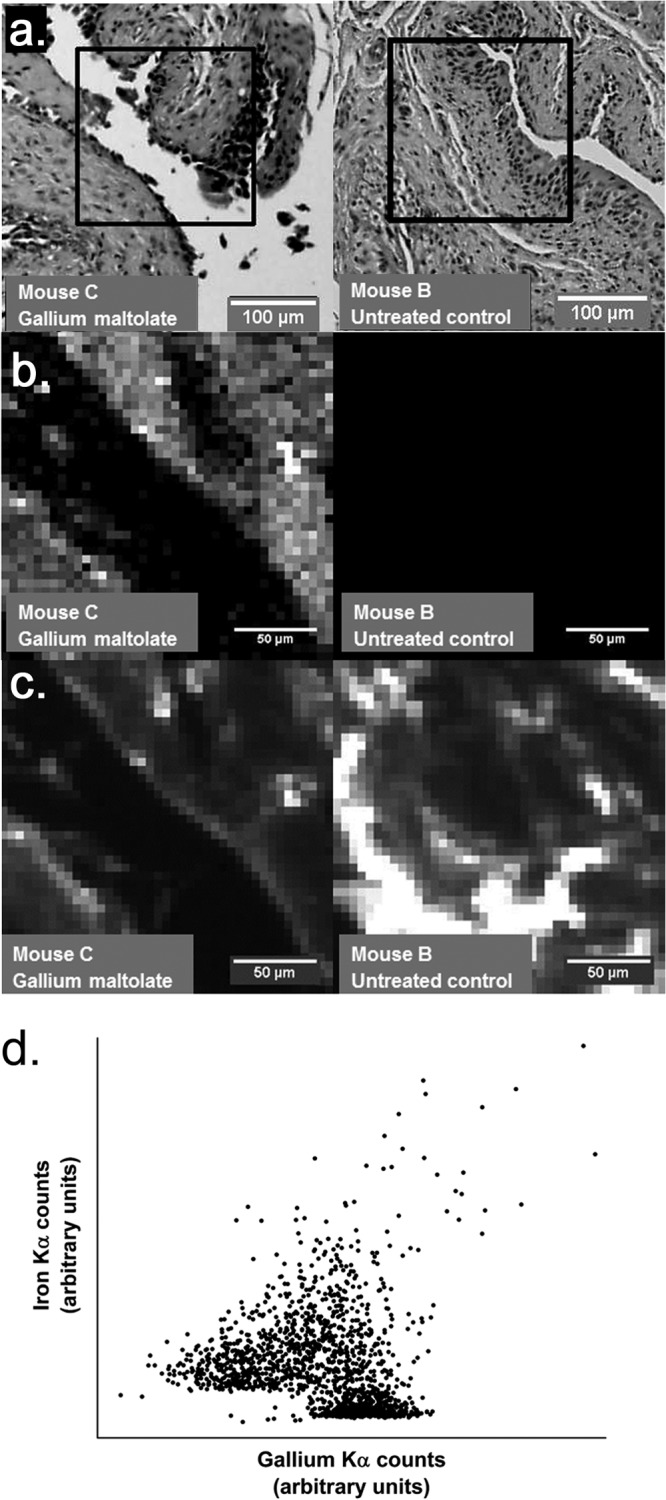
Fig 2.

Visible-light microscopy images, gallium distribution maps, and iron distribution maps of selected regions of bladder tissue from a mouse treated with gallium maltolate and an untreated control mouse. (a) Hematoxylin-and-eosin-stained sections of bladder tissue from mouse C treated with gallium maltolate and untreated control mouse B. The regions represented in panels b and c are outlined. (b) Synchrotron X-ray fluorescence maps of gallium distribution in bladder tissue from gallium maltolate-treated mouse C and from untreated control mouse B. These maps were collected from the regions outlined in panel a. The relative fluorescence signal intensity at each pixel is indicated by a color gradient where white represents a strong signal (indicating high local gallium concentration) and black represents a weak signal; both images employ identically calibrated scales. The region of weak signals extending from the upper left corner to the lower right corner in the map from mouse C (left) corresponds to the bladder lumen. (c) Synchrotron X-ray fluorescence maps of iron distribution in bladder tissue from gallium maltolate-treated mouse C and untreated control mouse B. These maps were collected from the same locations shown in panels a and b. The relative fluorescence signal intensity at each pixel is indicated by a color gradient where white represents strong signals (indicating high local iron concentration) and black represents a weak signal; both images employ identically calibrated scales. (d) Scatter plot of iron counts versus gallium counts at each pixel in the X-ray fluorescence maps collected from gallium maltolate-treated mouse C (panels a, b, and c). Spearman's rho for this data set is 0.74 (P < 0.0001).
