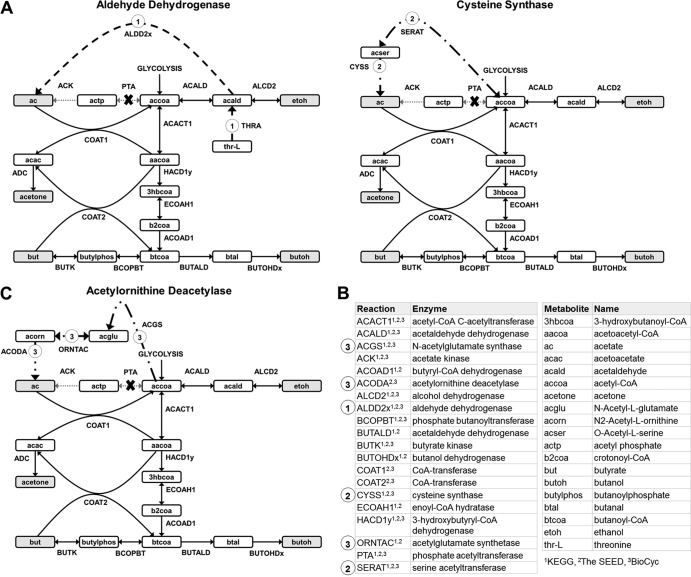
Fig 5.
Alternative acetate production pathways for the pta mutant as predicted by model iCM925. (A) Aldehyde dehydrogenase route; (B) cysteine synthase route; (C) acetylornithine deacetylase route. The gray boxes indicate a secreted product, the empty boxes indicate an internal metabolite, and the dotted gray lines indicate a blocked reaction as a result of the gene deletion. The thicker dashed lines represent the suggested alternative acetate production mechanisms. The model abbreviations for the metabolites and reactions included in the diagram are listed in the bottom right, along with superscripts indicating the reference annotation database(s) for each reaction.

