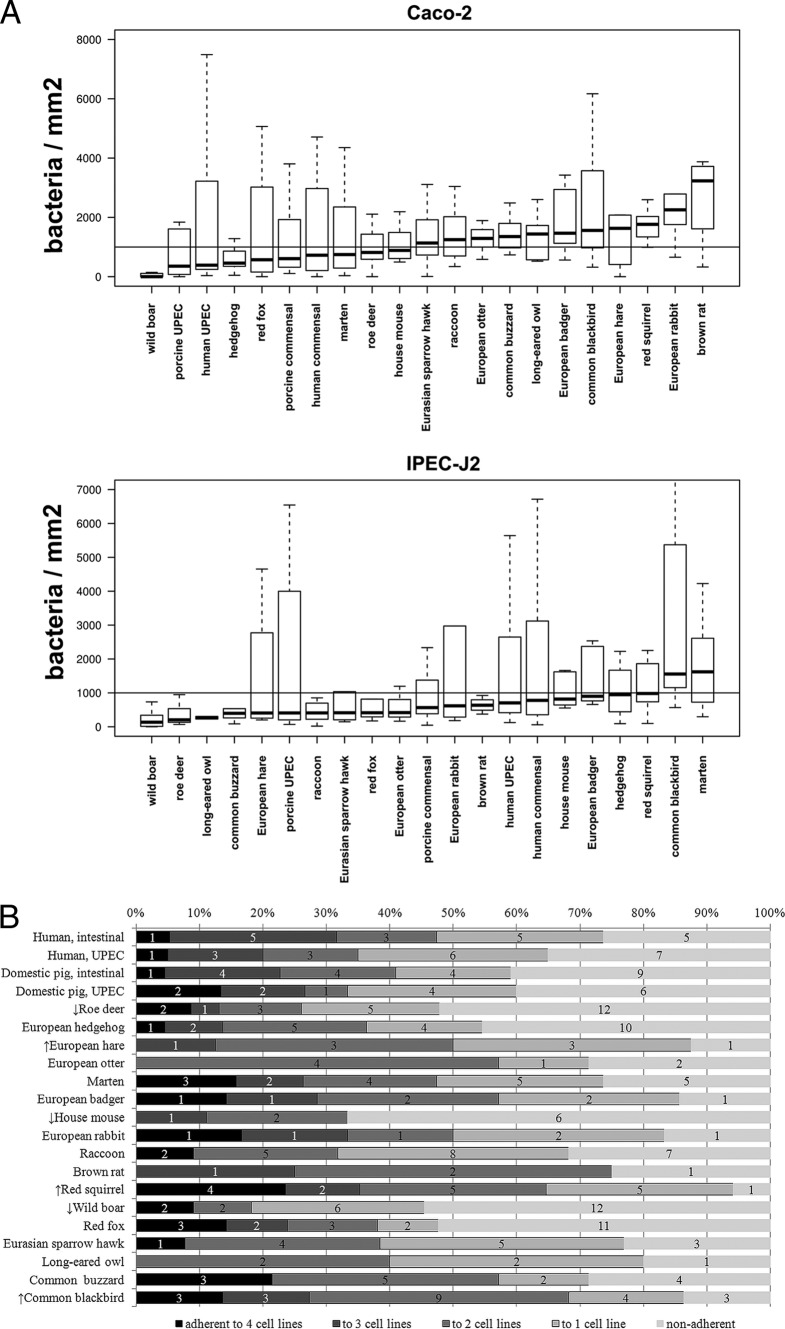
Fig 3.
(A) Species-specific adhesion visualized by box plots. The median adhesion (bacteria/mm2, y axis) of the isolates from each animal group to Caco-2 and IPEC-J2 cells is shown here as horizontal bold bars in the boxes. Many isolates were nonadherent. This explains why the median is often below the background noise of 1,000 bacteria/mm2 (horizontal line). (B) Species-specific adhesion of E. coli isolates to Caco-2, 5637, IPEC-J2, and PK-15 cells. Bordered gray bars, percentage of bacteria which adhered to four, three, two, or one cell line; nonbordered light gray bars, percentage of nonadherent bacteria. The numbers of isolates are given in the bars. The arrows indicate that the isolates of these species have either the highest (↑) or lowest (↓) average number of adhesion rates.

