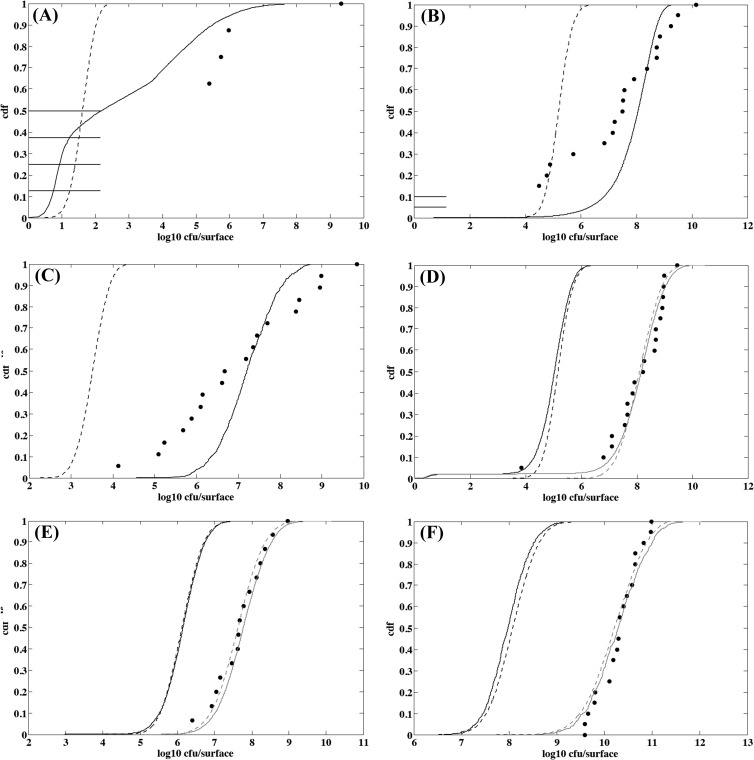
Fig 7.
Observed and simulated distributions of L. monocytogenes counts on irradiated smear soft cheese surface. (A) Five-day-old cheese from batch 2 contaminated with 8 cells and stored for 21 days at 15°C; (B) 7-day-old cheese from batch 3 contaminated with 21 cells and stored for 19 days at 15°C; (C) 5-day-old cheese from batch 2 contaminated with 630 cells and stored for 21 days at 15°C; (D) 12-day-old cheese from batch 3 contaminated with 7 cells and stored for 11 days at 15°C; (E) 19-day-old cheese from batch 2 contaminated with 24 cells and stored for 12 days at 15°C; and (F) 12-day-old cheese from batch 3 contaminated with 5,730 cells and stored for 11 days at 15°C. Points are observed counts, the solid line represents the distribution simulated with the IBM/microscale approach, and the dashed line represents the distribution simulated with the population/macroscale approach. Gray lines display distributions simulated by adjusting μopt to values ranging from 0.30 to 0.34 h−1 instead of 0.23 h−1.

