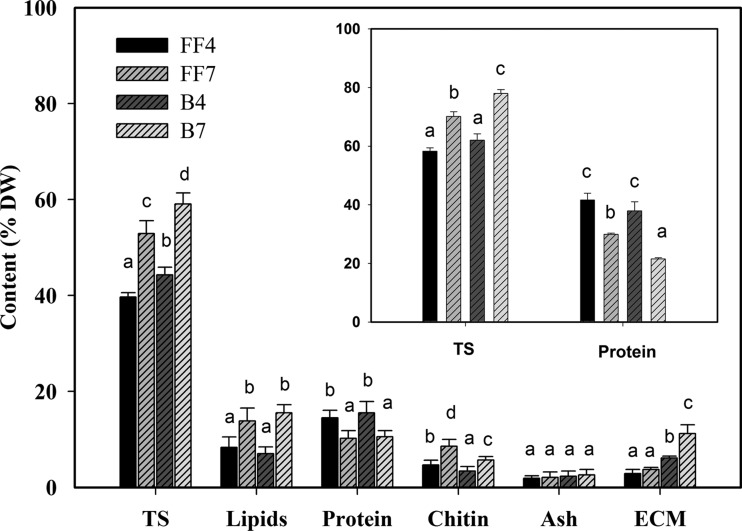
Fig 2.
Total sugars (TS), lipid, protein, chitin, and ash contents and percent amounts of extracted ECM in free-floating (FF) and biofilm (B) biomasses after 4 and 7 days incubation in the MBEC P&G system at 30°C under orbital shaking (150 rpm). The inset shows the percent composition, referred to as the ECM dry weight, of protein and TS for each biomass type. With the sole exceptions of ECM and ash, data are the means ± the standard deviations of nine determinations (three replicates for three samples), and same lowercase letters above bars indicate the lack of statistically significant differences for each parameter among culture systems. ECM and ash determinations were performed in triplicate.

