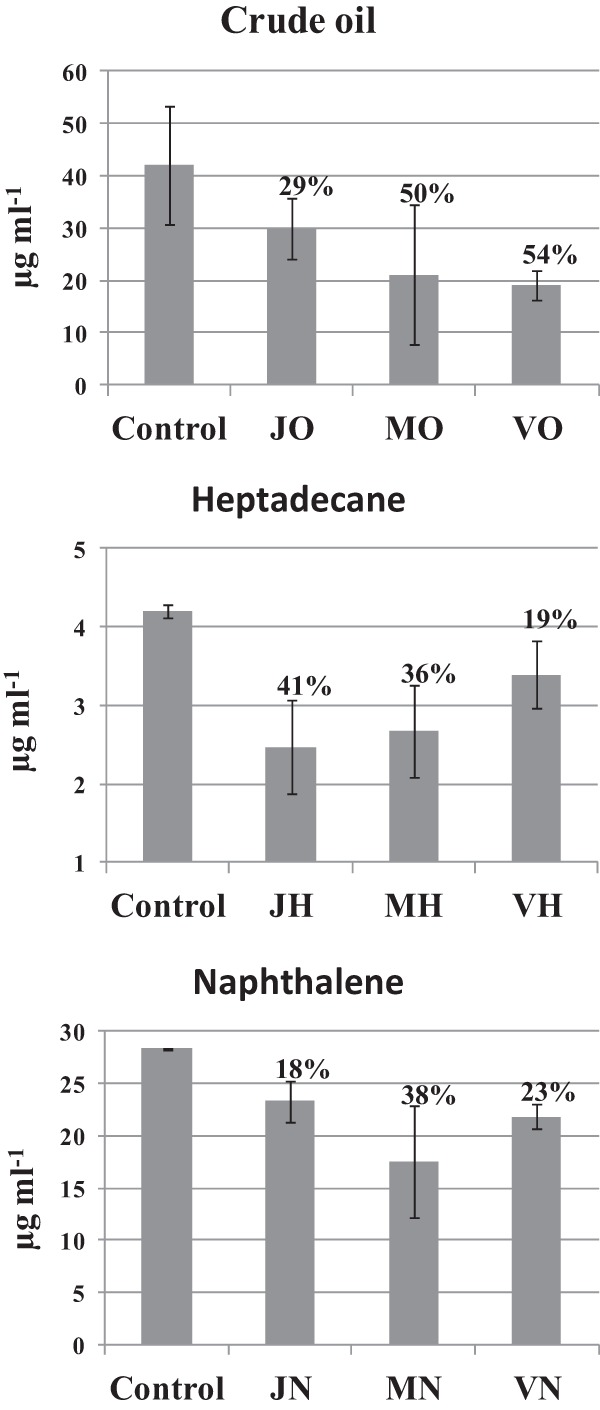
Fig 1.

TPH quantification after the 32nd day of incubation of the microcosms. The degradation values (above the bars) were determined as the ratio between the average values obtained for the contaminated microcosms and those obtained for the negative controls used in this study. The samples are denoted as follows: the first letter represents the origin of the sample (J, Jacarepiá Lagoon; M, Massambaba Beach; V, Vermelha Lagoon), followed by the hydrocarbon used in the different microcosms (H, heptadecane; N, naphthalene; O, crude oil).
