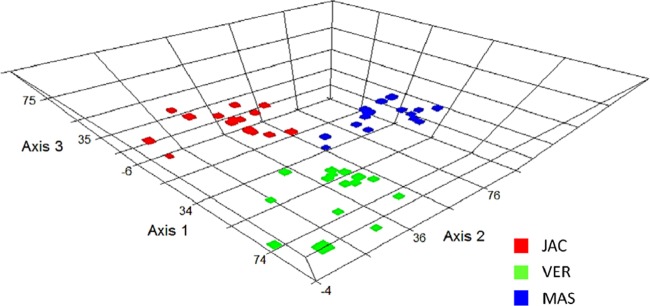
Fig 2.

An RDA ordination diagram based on the genetic fingerprint data obtained from hydrocarbon-enriched bacterial communities. The data were plotted using each aquatic ecosystem type, and the different colors represent the microcosm samples obtained from Vermelha Lagoon (VER; green), Massambaba Beach (MAS; blue), and Jacarepiá Lagoon (JAC; red). The detailed genetic fingerprint pattern is presented in Fig. S2B in the supplemental material.
