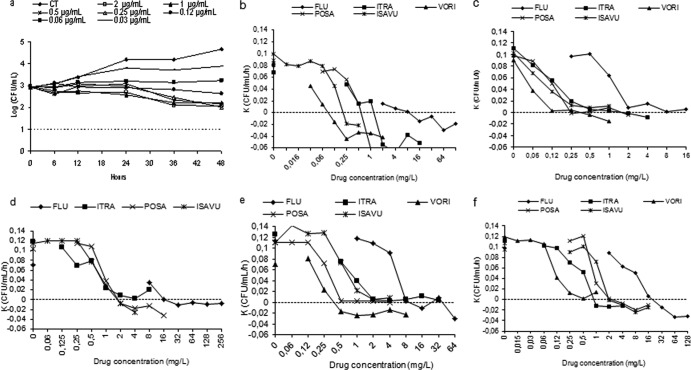
Fig 1.
Representative time-kill plots for ATCC T. asahii after exposure to voriconazole (a) and killing rates of fluconazole (FLU), itraconazole (ITRA), voriconazole (VORI), posaconazole (POSA), and isavuconazole (ISAVU) against T. asahii ATCC 201110, isolate 1, isolate 2, isolate 3, and isolate 4 (b to f). CT, drug-free control; above the dotted line, growth; dotted line, the starting point of killing activity. The voriconazole correlation coefficient value is low (R2 < 0.8) for isolate 2 and so has been omitted.

