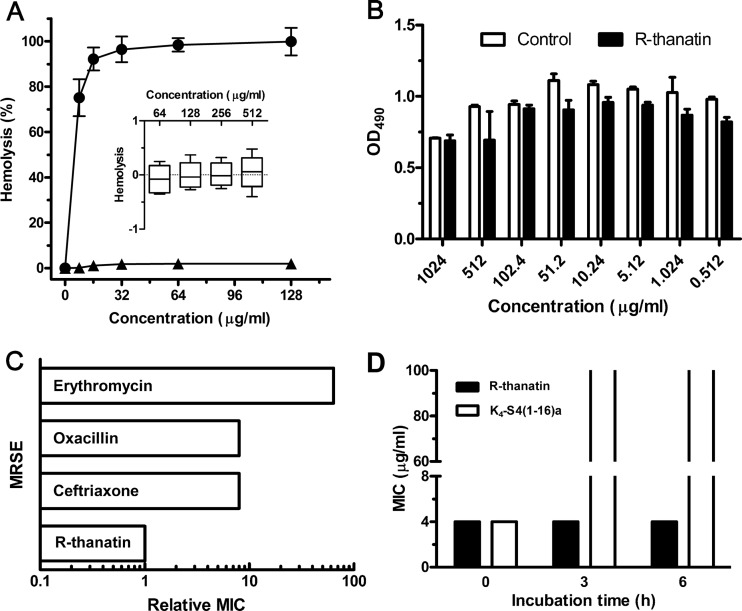
Fig 2.
Selectivity, stability, and antibiotic resistance induction of R-thanatin in vitro. (A) Hemolytic toxicities of R-thanatin (triangles) and melittin (circles) determined with human red blood cells (2% hematocrit) after 1 h of incubation. The inset shows toxicity of R-thanatin after 6 h of incubation with 10% hematocrit. The data are shown as mean ± SD values for 3 samples. (B) The absorbance at 490 nm of HUVE cells after incubation without or with various concentrations of R-thanatin for 48 h. Each plot was obtained from a representative experiment, and the data points are the means for four replicates ± standard deviations. (C) Emergence of resistance in MRSE after 15 serial passages in the presence of antimicrobials. “Relative MIC” is the normalized ratio of the MIC obtained for the 15th subculture to the MIC obtained upon first exposure. Data are from a representative experiment that was repeated twice with the same results. (D) Antibacterial activity before and after preincubation of R-thanatin (black) and K4-S4 (1–16)a (white) in 50% human plasma. Data are from a representative experiment that was repeated twice with the same results.

