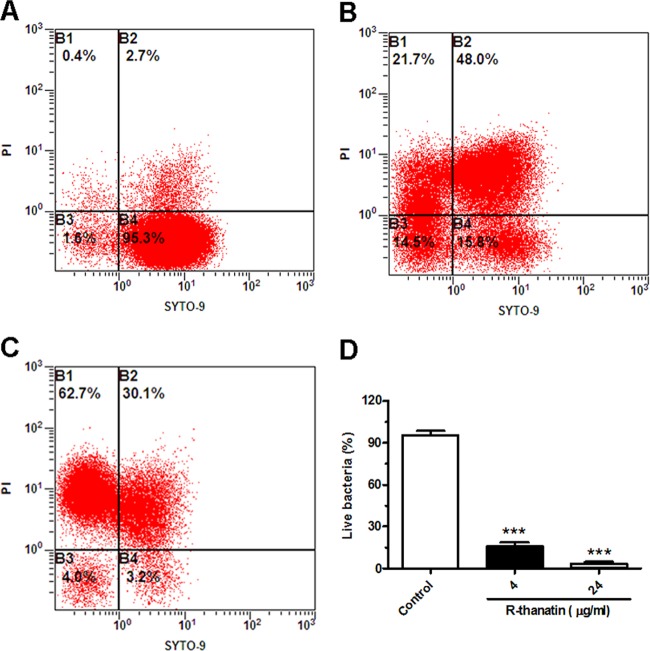
Fig 8.
Analysis of relative viabilities of MRSE suspensions by flow cytometry. Compounds were added to cell cultures containing MRSE to a final concentration of 4 (B) or 24 (C) μg/ml R-thanatin, with the addition of an equal volume of diluent as a control (A). Aliquots of each culture were collected at 37°C for 90 min and were stained for 15 min with the dyes Syto 9 and propidium iodide (PI). Then, bacteria were analyzed by using an Epics XL flow cytometer to assess the percentage of live or dead bacteria (A, B, and C). The numbers indicate the percentages of live bacteria within MRSE after treatment with different concentrations of R-thanatin (D). The values show the means ± SD for 3 samples. ∗∗∗, P < 0.001 compared with results for control groups.

