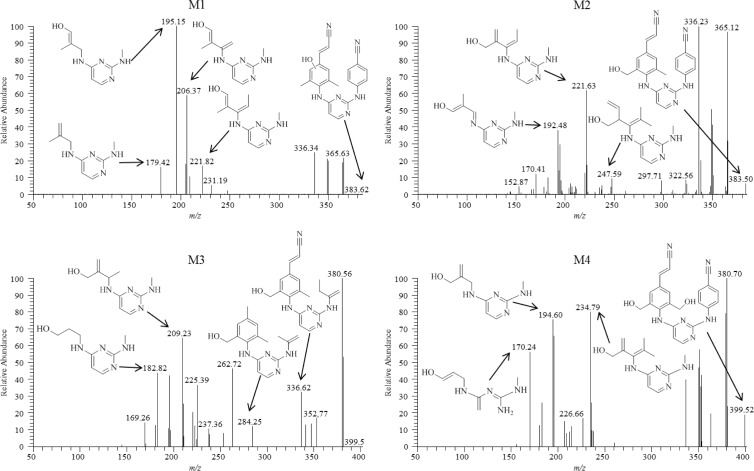
Fig 3.
Fragmentation spectra of monohydryoxylated metabolites M1 and M2 (top) and dihydroxylated metabolites M3 and M4 (bottom). Proposed modes of fragmentation are indicated by the fragment ion corresponding to the appropriate mass-to-charge ratio. Human liver microsomes (2 mg/ml) were incubated with 20 μM RPV for 30 min at 37°C in the presence of an NADPH-regenerating system. Metabolites were detected in MS/MS mode using parent masses of 383 m/z for M1 and M2 and 399 m/z for M3 and M4. Spectra are representative of three individual experiments.

