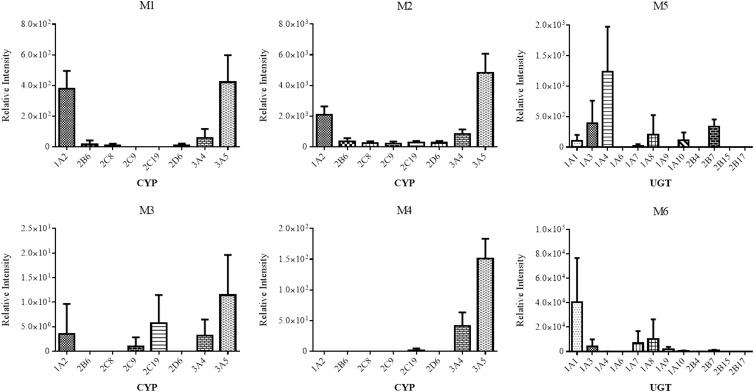
Fig 5.
Relative contributions of individual drug-metabolizing CYPs and UGTs to RPV metabolite formation. cDNA-expressed CYPs (10 pmol/ml) were incubated with 20 μM RPV for 30 min at 37°C in the presence of an NADPH-regenerating system. For UGT assays, cDNA-expressed CYP3A4 (10 pmol/ml) was preincubated with 20 μM RPV, an NADPH-regenerating system, and UDPGA from 30 min at 37°C, to which 0.2 mg/ml of cDNA-expressed UGTs was added for an additional 60-min incubation. Metabolite formation was detected by UHPLC-MS/MS in SRM mode using the following transitions: 383→222 m/z (M1 and M2), 399→183 m/z (M3), 399→196 m/z (M4), 543→367 m/z (M5), and 559→383 m/z (M6). Glucuronide M7 was not detected under the UGT assay conditions. Data are representative of the mean relative peak intensities of three experiments ± standard deviations.

