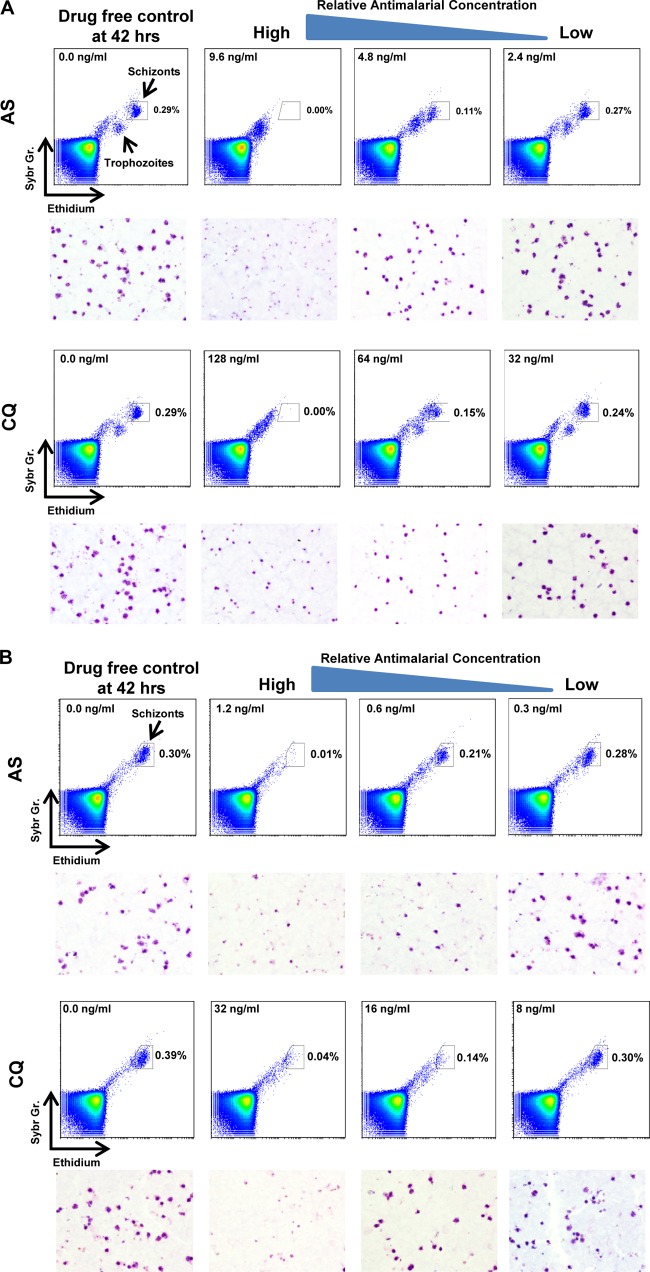
Fig 1.
Representative flow cytometry plot outputs from chloroquine (CQ) and artesunate (AS) sensitivity assays conducted on P. falciparum (A) and P. vivax (B). The target gate representing schizont development events is indicated on each plot. Underneath the plots are the corresponding micrographs of Giemsa-stained thick films collected from the same culture wells.

