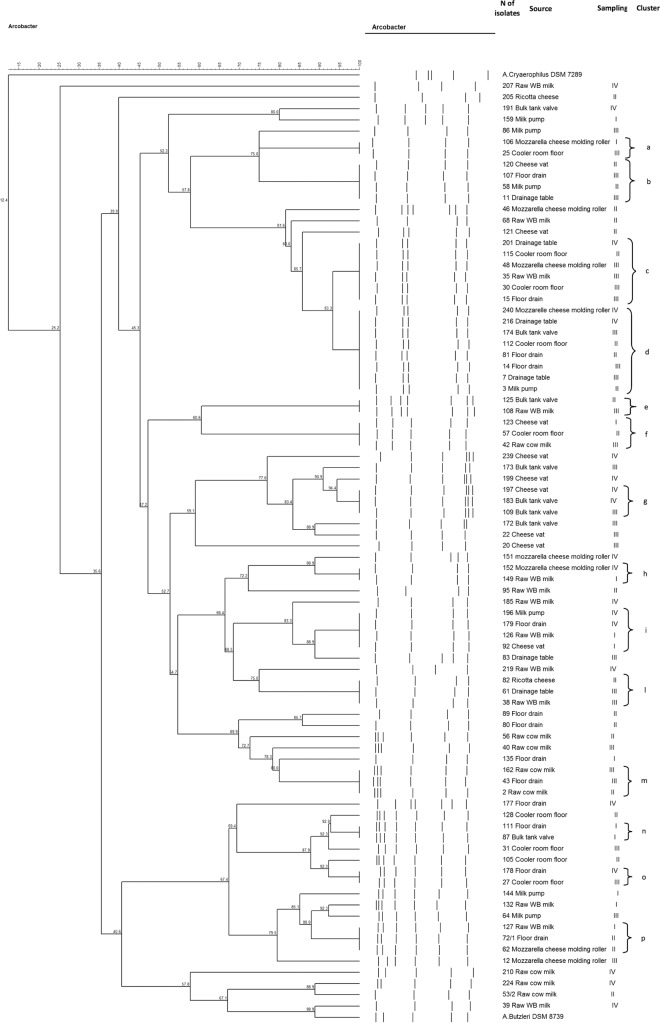
Fig 1.
Distribution of SacII digestion PFGE patterns of A. butzleri isolates. Information on the sources of isolates and sampling days (10 and 24 October 2012, 21 November 2012, and 5 December 2012, reported as I, II, III, and IV, respectively) of isolates belonging to the clusters is presented at the side of the dendrogram. The numbers on the horizontal axes indicate percentages of similarity, as determined by Dice correlation coefficient analysis and UPGMA clustering. Letters a to p represent the clusters. Isolates with the same PFGE pattern in the same sample are reported once.

