
Fig 3.
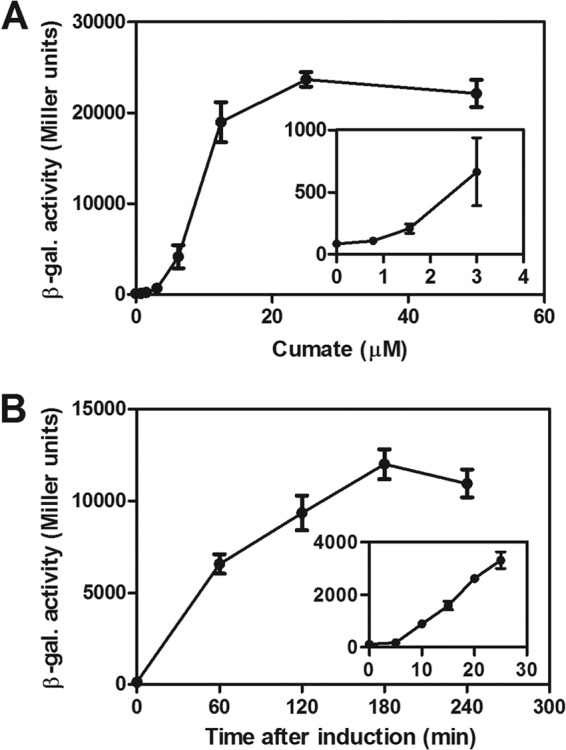
(A) Dose-response curve of PQ5 assayed as β-galactosidase (β-gal.) activity of the PQ5-lacZ+ transcriptional fusion in the Sphingomonas Fr1 wild type (strain JVZ857/pQF-lacZ) grown with different cumate concentrations (no cumate and 2-fold increments from 0.78 to 50 μM cumate). The inset is a closeup of the same dose-response curve illustrating responsiveness to low cumate concentrations. (B) Induction kinetics of PQ5 was assayed by adding 50 μM cumate to a noninduced culture of strain JVZ857/pQF-lacZ in the mid-exponential phase and following β-galactosidase activity of PQ5-lacZ+ over time. The inset represents a set of independent experiments focusing on the first 25 min after inducer addition. Data represent the means ± standard deviations of the results of three independent biological replicate experiments, each performed with two technical replicates.