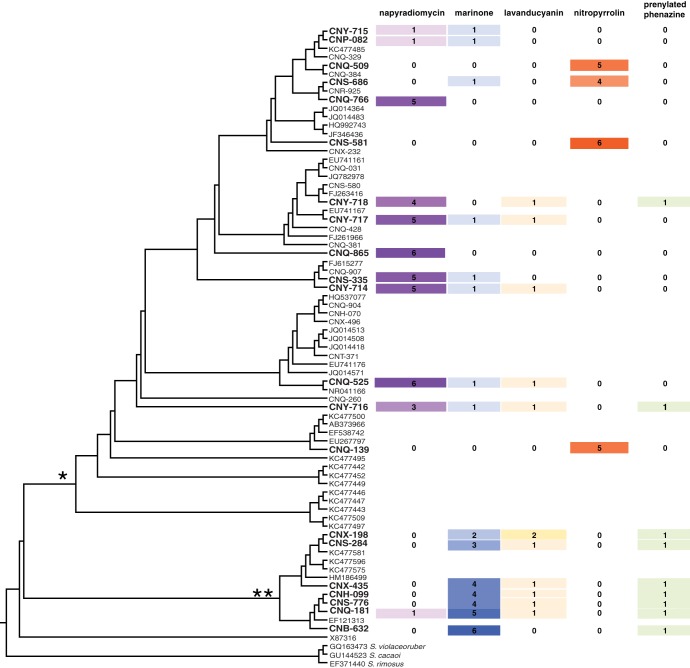
Fig 5.
Lineage-specific HI production by MAR4 strains. The 16S rRNA gene phylogeny shown in Fig. 1 is displayed as a cladogram. Strains analyzed for HI production are in bold. For each strain analyzed, the number of compounds detected within each class is indicated by number and color intensity according to the number detected. * and ** indicate the clades represented by the S. aculeolatus and S. synnematoformans type strains, respectively.

