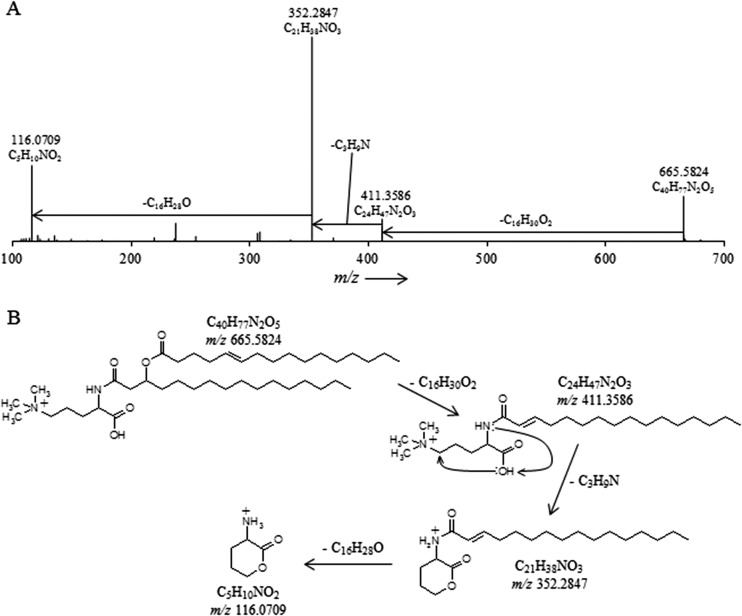
Fig 3.
(A) High-resolution accurate-mass quadrupole OT/MS2 mass spectrum of T. sphagniphila lipid extract group III TMO m/z 665.5824 (C16:1/C16:0). The chemical formulas represent neutral losses and products after MS2 fragmentation. (B) Proposed gas phase fragmentation pathway of trimethylornithine m/z 665.5824.

