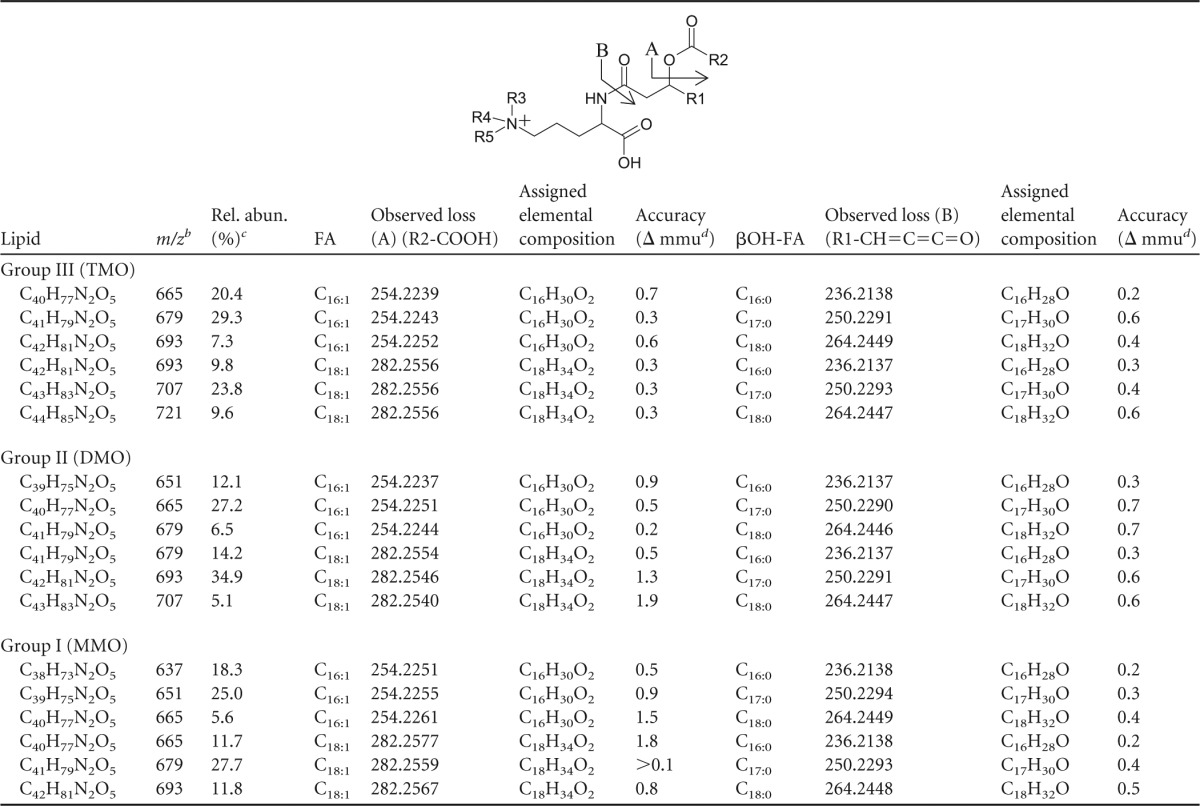
Table 2.
m/z of the molecular species, fatty acid losses, elemental compositions, and accuracy values that occur during MS fragmentation of each mass in lipid groups III, II, and Ia

R2-COOH and R1-CH=C=C=O losses result from fragmentation to fatty acid (FA) and βOH-FA, respectively, in the structure shown. TMO, R3 = R4 = R5 = CH3; DMO, R3 = R4 = CH3, R5 = H; MMO, R3 = CH3, R4 = R5 = H.
Group III, M+; groups I and II, [M+H]+.
Rel. abun., relative abundance, i.e., the peak area percentage of each lipid within its respective group.
