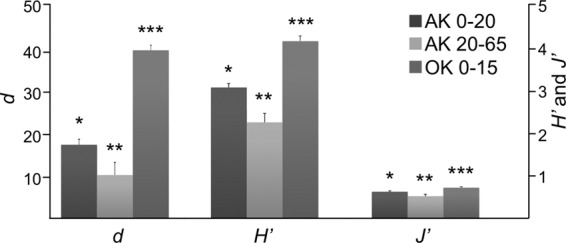
Fig 5.

Measures of species richness (Margalef; d), Shannon diversity (H′), and evenness (Pielou; J′) for the Oklahoma (OK) (0- to −15-cm depth) and Alaska (AK) samples, parsed into shallow (0- to −20-cm) and deep (−20- to −65-cm) samples with standard errors. Asterisks indicate grouping based on ANOVA (P < 0.01).
