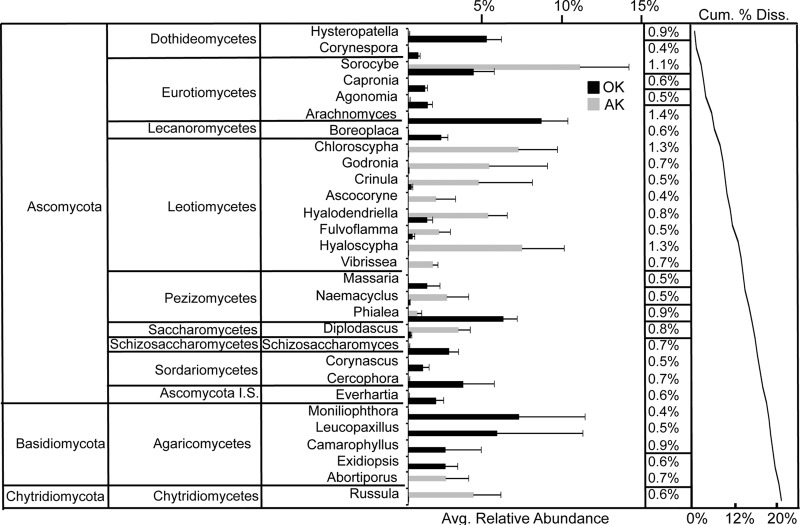
Fig 7.
Similarity percentage (SIMPER) analysis differentiating Alaska (AK, 0- to −20-cm) and Oklahoma (OK, 0 to −15 cm) samples. Bars indicate percentages of sequence relative abundance within each genus-level bin with standard errors. Percentages to the right indicate the percent dissimilarity contributed by each bin. The line graph indicates the cumulative percent dissimilarity (Cum. % Diss.) between sites.

