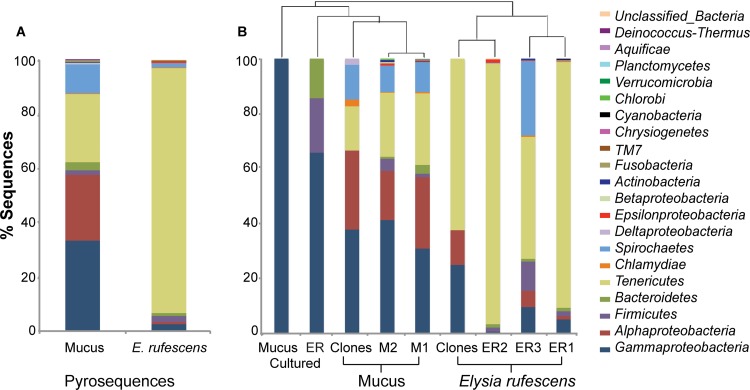
Fig 1.
Percentages of total sequences representing various bacterial phyla. Combined pyrosequences from secreted mucus from E. rufescens and entire E. rufescens (A) and from all samples (B). OTUs were defined by 3% sequence difference from the nearest neighbor. Groups are shown in the order in which they are listed.

