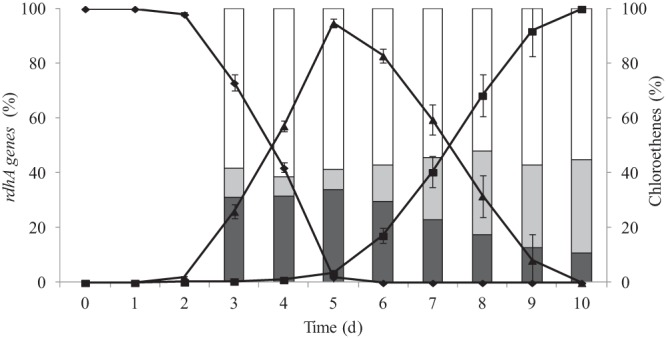
Fig 3.

Transformation of chloroethenes and interplay of rdhA genes in the SL2-PCEb culture along the dechlorination of PCE to cis-DCE. Chloroethenes are represented by diamonds for PCE, triangles for TCE, and squares for DCE. Dark gray bars represent the relative abundances of pceATCE, light gray bars represent those of pceADCE, and white bars represent those of rdhA2. The figure was obtained by averaging the data obtained from two independent batch cultures.
