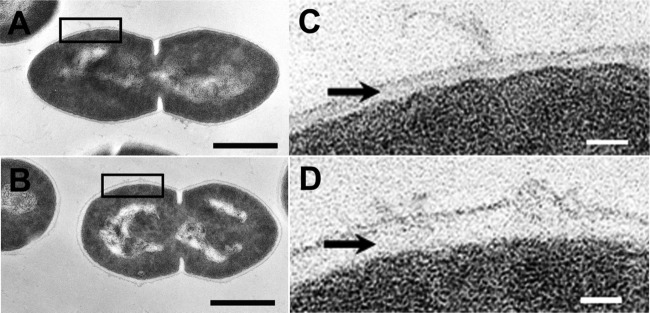
Fig 3.

(A to D) Transmission electron micrographs of strain CM4A in the absence (A and C) and presence (B and D) of 2.0% butanol. The transmission electron micrographs in panels C and D are magnified views of the black boxes in panels A and B, respectively. The black arrows point to the positions of the capsule. The average capsule thicknesses were 17 ± 3.7 nm and 32 ± 3.7 nm in the absence and presence, respectively, of 2.0% butanol (P < 0.01 by t test). Bars, 0.5 μm (A and B) and 50 nm (C and D).
