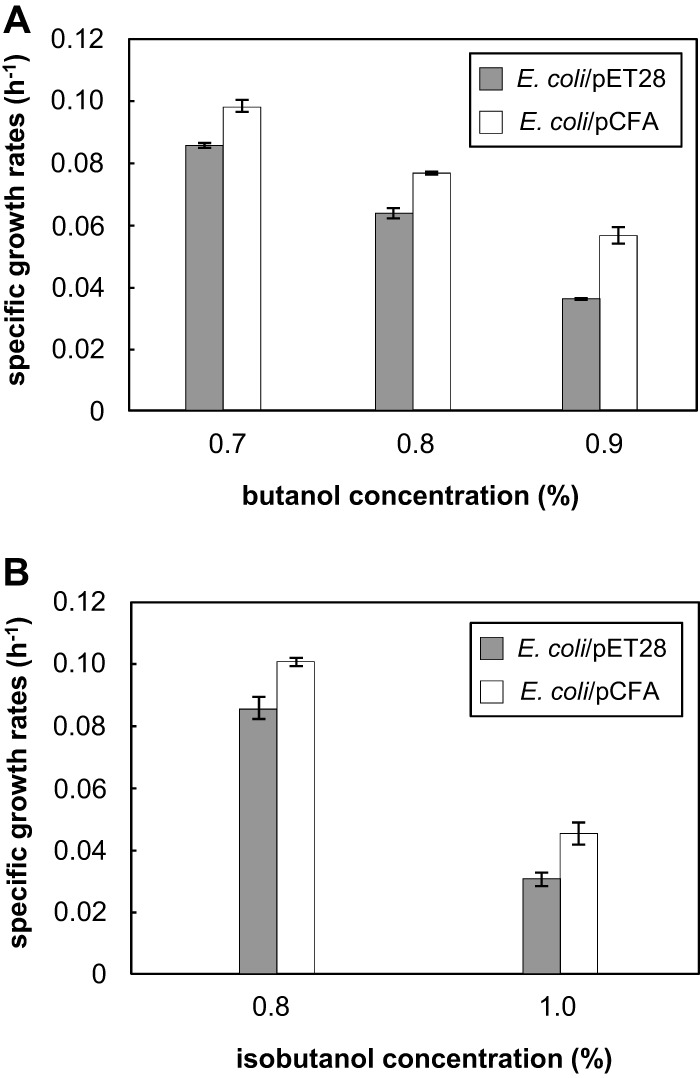
Fig 4.

Butanol (A) and isobutanol (B) tolerance of E. coli/pCFA and the control strain E. coli/pET28 showing the differences in growth rates in the presence of butanol and isobutanol. To induce heterologous gene expression, 0.01 mM IPTG was added to each strain. Values are means ± standard deviations (SD) (error bars) of triplicate experiments. The growth rates of the E. coli/pCFA and E. coli/pET28 strains without solvent were equal.
