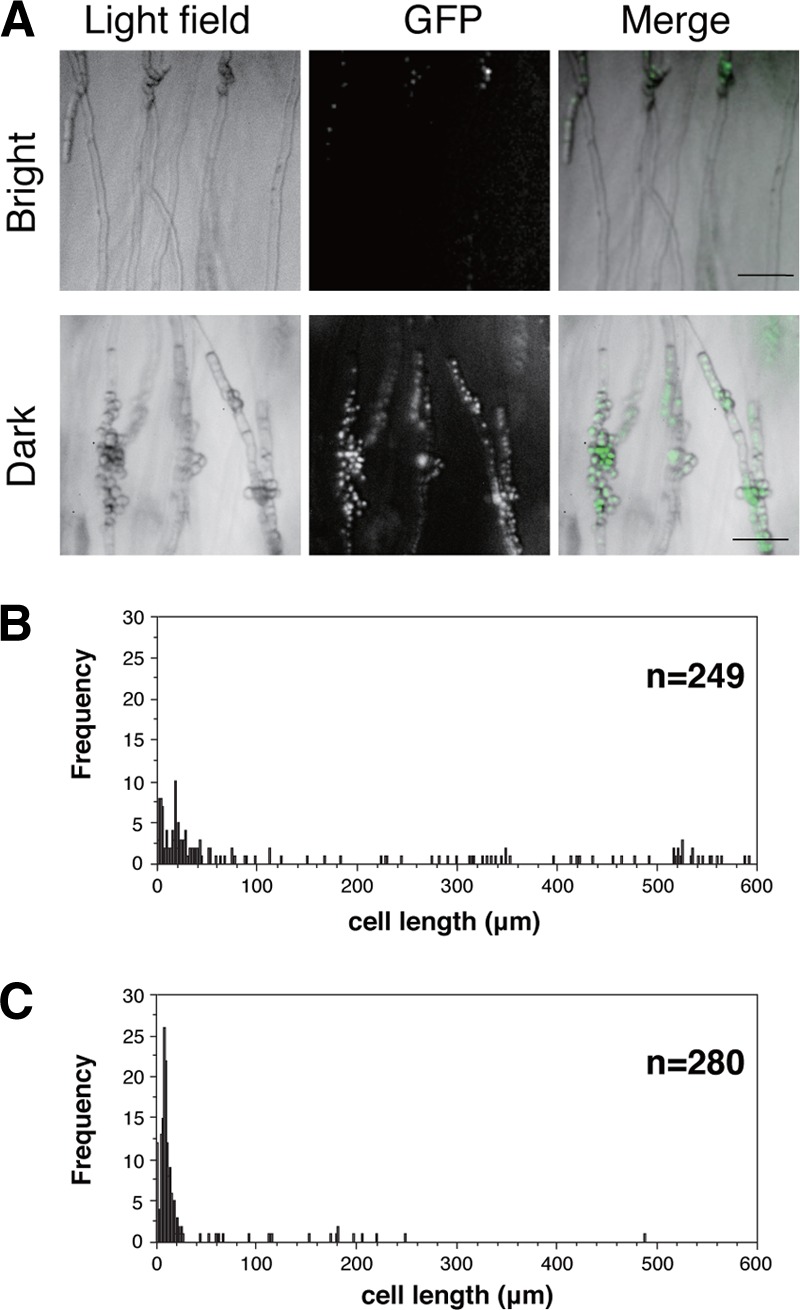
Fig 4.

Hyphal cells in dark- and bright-colored stripes. (A) Images of hyphal cells taken by a fluorescence stereomicroscope. Hyphal cells are shown in a bright-colored stripe (upper row) and a dark-colored stripe (lower row). A yeast strain (NIG5097) with histone H3 proteins labeled by GFP was used to detect nuclei. Bar, 0.1 mm. (B and C) Distributions of cell length in the bright-colored stripe (B) and dark-colored zone (C). The average length of cells in the bright-colored segment is 142 ± 189 μm (mean ± standard deviation [SD]; n = 249), and the average length of cells in the dark-colored segment is 24 ± 51 μm (mean ± SD; n = 280).
