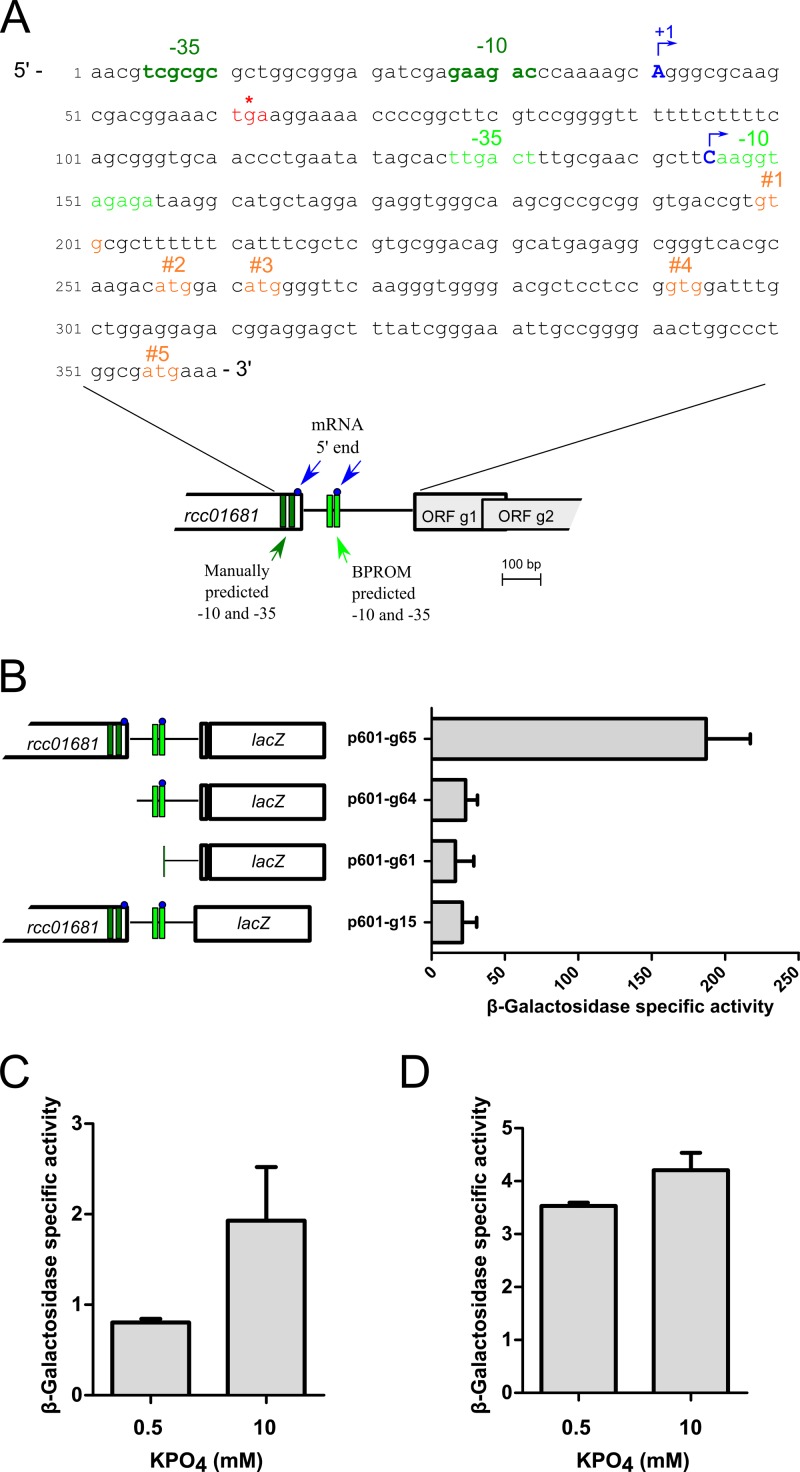
Fig 2.
Mapping of the RcGTA promoter and effect of phosphate concentration on RcGTA gene transcription. (A) Annotated sequence and schematic representation of the promoter region of ORF g1 of the RcGTA promoter region. Dark green and light green, −10 and −35 boxes manually annotated and identified by BPROM, respectively; blue, 5′ ends of mRNA identified using 5′ RACE; orange, putative translational start codons for ORF g1 from the literature; red asterisk, annotated stop codon of rcc01681. (B) Schematic representation of ORF g1::lacZ fusions constructs (left) and β-galactosidase activities of strain Y262 containing the indicated plasmid (right); plasmid names ending in -g61, -g64, and -g65 encode fusions to putative start codon 5, whereas plasmid p601-g15 encodes a fusion to putative start codon 4. (C) β-Galactosidase specific activities of WT strain SB1003 containing ORF g1::lacZ fusion plasmid p601-g65 grown in RCVm containing 0.5 mM or 10 mM KPO4 for 36 h. (D) β-Galactosidase specific activities of strain SB555 containing the ORF g1::lacZ fusion plasmid p601-g65 grown in RCVm containing 0.5 mM or 10 mM KPO4 for 24 h. Error bars represent the standard deviations of three biological replicates.

