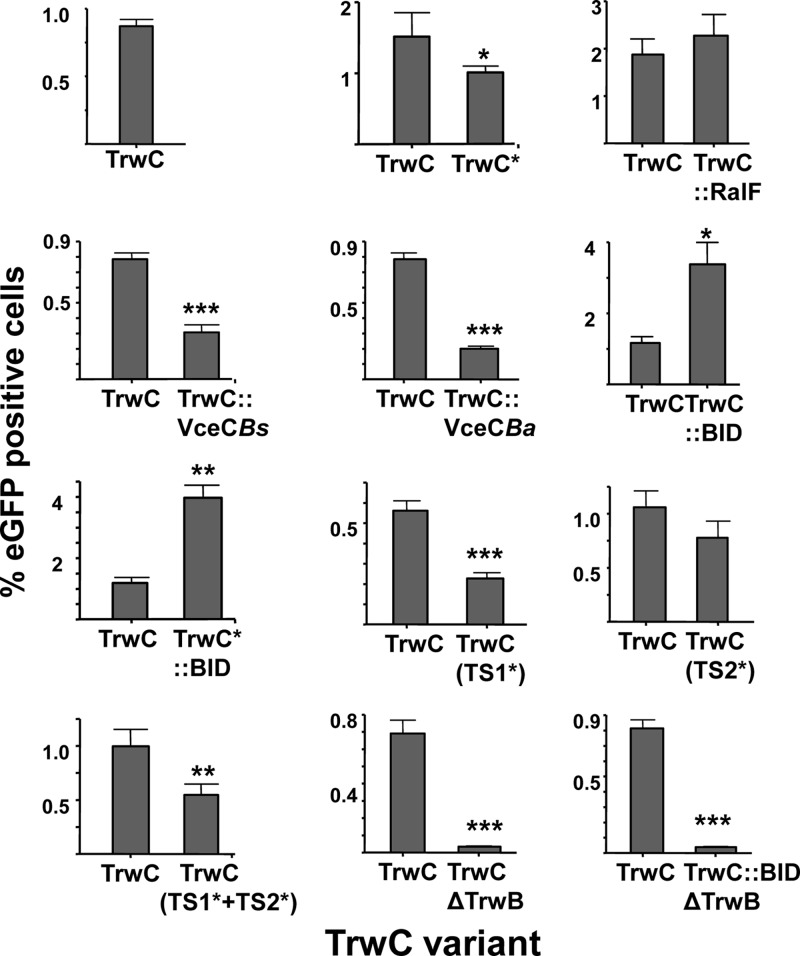
Fig 4.
Percentages of eGFP-positive EA.hy926 cells infected by B. henselae carrying the indicated TrwC variant compared with its own positive control. The TrwC derivative in each construct is indicated at the bottom, as in Fig. 3. The data shown come from the subset of experiments in which the particular construct was assayed in parallel with its positive control. The bars represent means from at least 3 independent experiments done in triplicate. The error bars indicate standard errors of the mean. Student's t test was used to analyze the data referred to the positive control, TrwC. *, P ≤ 0.01; **, P ≤ 0.001; ***, P ≤ 0.0001.

