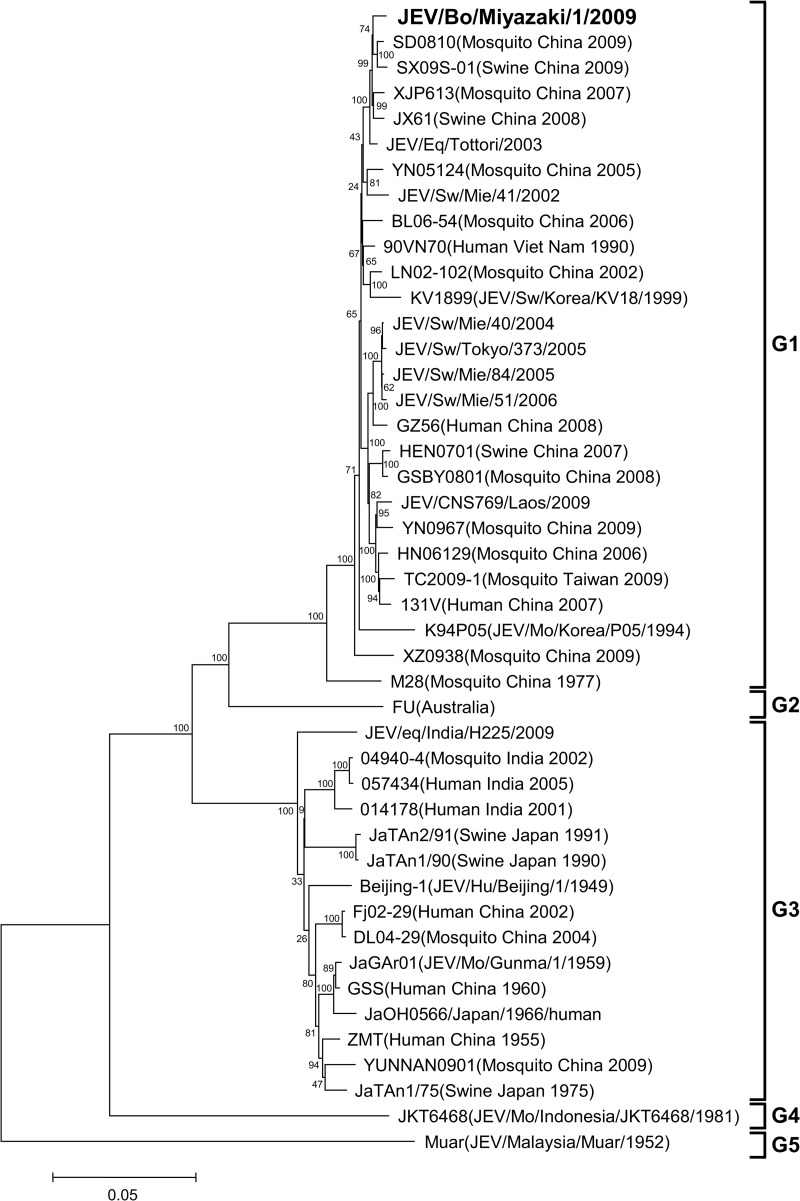
Fig 2.
Phylogenetic profile showing the relationships among JEV isolates based on a comparison of the complete genome (approximately 11,000 nucleotides). The bootstrap percentages calculated from 1,000 replications are indicated around the internal nodes. The scale represents 0.05% sequence divergence.

