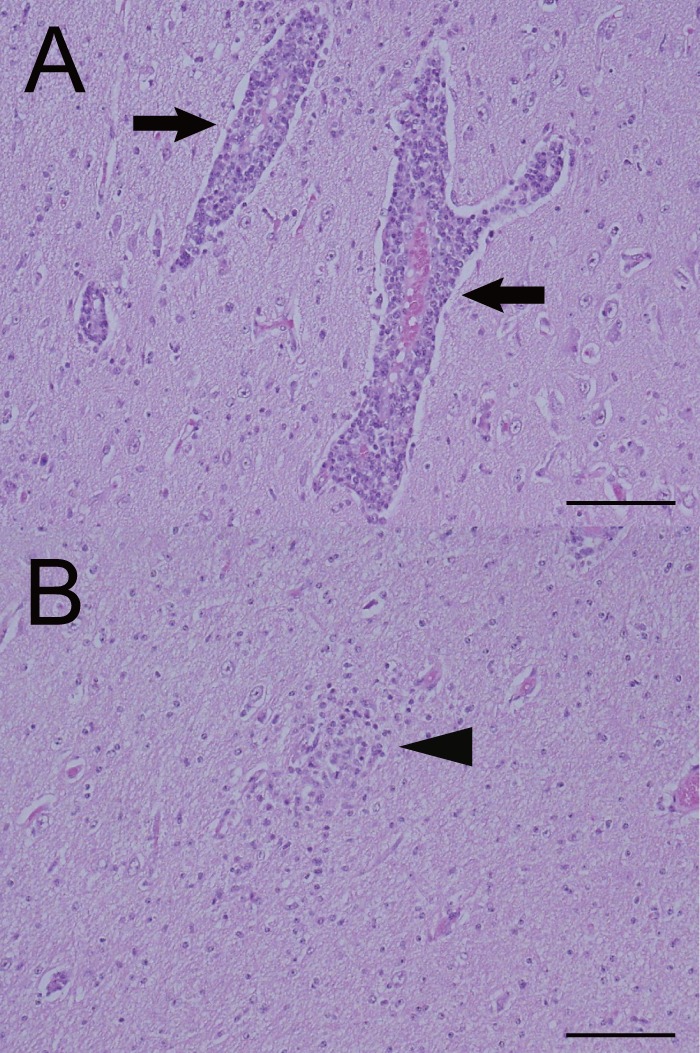
Fig 3.

Perivascular infiltration of lymphocytes (A) and a glial nodule (B) in the cerebrum of the affected calf. Arrows indicate the perivascular infiltration of lymphocytes, and an arrowhead points out the glial nodule. Hematoxylin and eosin stain. Bar = 200 μm.
