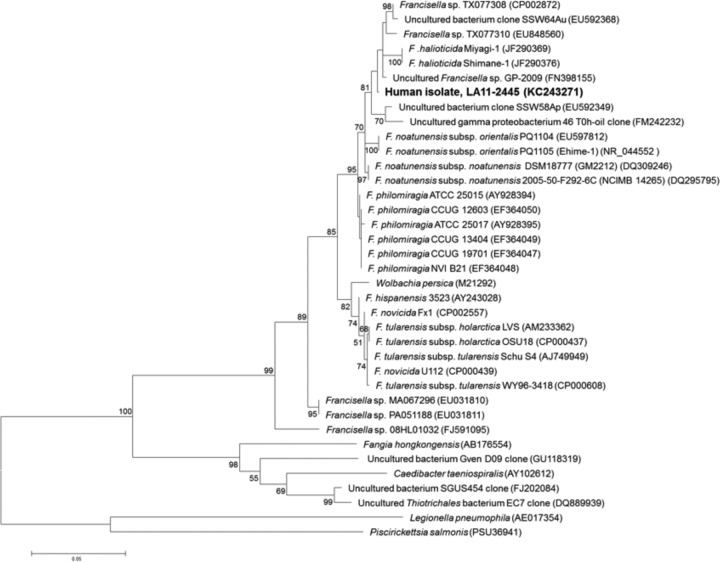
Fig 2.
Maximum-likelihood (ML) analysis showing the relationship of the clinical isolate, LA11-2445, to other Francisellaceae members based on a 1,205-bp region of the 16S rRNA gene. Bootstrap support values >50% are indicated. The scale bar corresponds to 0.05 substitutions per nucleotide position. GenBank accession numbers are indicated following strain designations.

