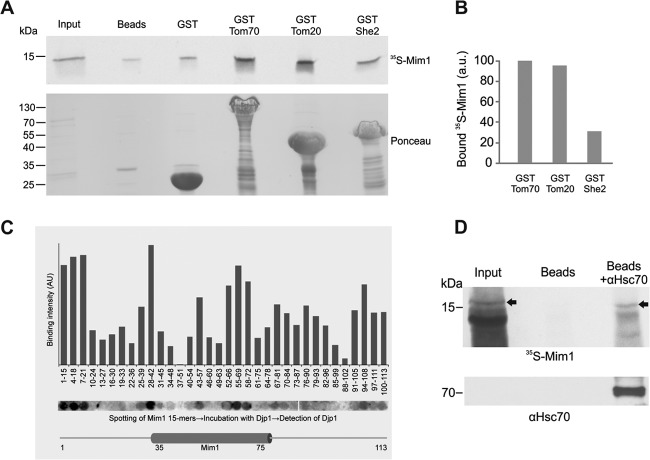
Fig 9.
Mim1 can physically bind Tom70, Tom20, Djp1, and Hsp70. (A) The cytosolic domain of Tom70 and Tom20 can recognize newly synthesized Mim1 molecules. Radiolabeled Mim1 was mixed with glutathione beads or with beads harboring GST or GST fused to either the cytosolic domain of mitochondrial proteins Tom70 (GST-Tom70) and Tom20 (GST-Tom20) or to the cytoplasmic protein She2 (GST-She2). The beads were washed, after which bound material was eluted with sample buffer. Aliquots of the input (5%) and bound material (100%) were analyzed by SDS-PAGE followed by Ponceau staining (lower panel) and autoradiography (upper panel). The samples with GST-tagged Tom70, Tom20, and She2 contain degradation products of the fusion proteins (Ponceau staining [lower panel]). (B) The intensity of the radioactive bands corresponding to 35S-Mim1 pulled down with the three different GST-tagged proteins was quantified and is presented as a percentage of the amount of protein bound by Tom70. (C) A peptide library on a cellulose membrane covering the entire sequence of Mim1 was incubated with purified Djp1his. Bound protein was detected with antibodies against Djp1, and binding was quantified by scanning densitometry of the spots. Different segments of Mim1 are displayed below the corresponding peptides. The putative transmembrane domain (amino acid residues 35 to 75) is indicated. (D) Mim1 physically interacts with Hsc70. Protein G-Sepharose beads were left untreated or were preincubated with anti-Hsc70 antibody before addition of rabbit reticulocyte lysate containing radiolabeled Mim1. The beads were washed and bound material was eluted. The major portion of the eluted material (85%) was analyzed via SDS-PAGE followed by autoradiography (upper panel), whereas the remaining 15% was analyzed by SDS-PAGE and immunodecorated with antibody against Hsc70 (lower panel). Arrows in the upper panel indicate the bands corresponding to radiolabeled Mim1. A very strong band at 14 kDa represents hemoglobin that is extremely abundant in the reticulocyte lysate. Input refers to 1% of the volume of lysate used in the pulldown samples.

