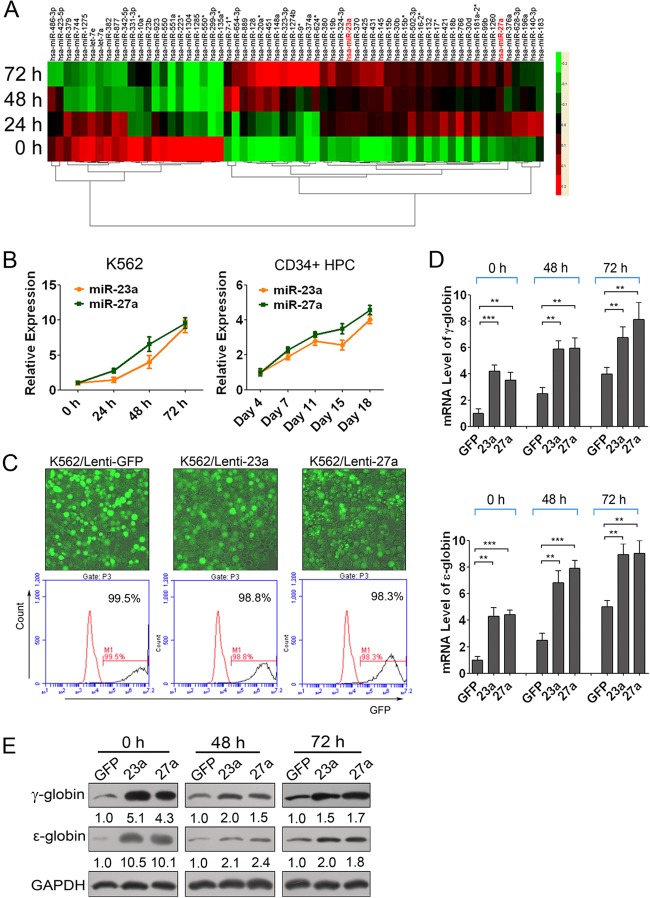
Fig 1.
miR-23a and miR-27a upregulated β-like globin genes in K562 cells. (A) Heat map representation of the expression change of 63 miRNAs that consistently increased or decreased during erythroid differentiation in the miRNA microarray analysis of hemin-induced K562 cells at 0, 24, 48, and 72 h. (B) qPCR validation of the expression of mature miR-23a and miR-27a in hemin-induced K562 cells and Epo-induced CD34+ HPCs. (C) Fluorescence image merged with phase of lentivirus-infected K562 cells and FACS analysis of GFP-positive cells. (D) qPCR analysis of ε- and γ-globin gene expression normalized with GAPDH in miR-23a- and miR-27a-overexpressing K562 cells at 0, 48, and 72 h of hemin induction. (E) Western blot analysis of ε- and γ-globin expression in miR-23a- and miR-27a-overexpressing K562 cells at 0, 48, and 72 h of hemin induction. Student's t test (two-tailed) was performed to analyze data from the experiments in triplicate. P values of <0.05 were considered significant, as indicated by the asterisks (*, P < 0.05; **, P < 0.01; ***, P < 0.001).

