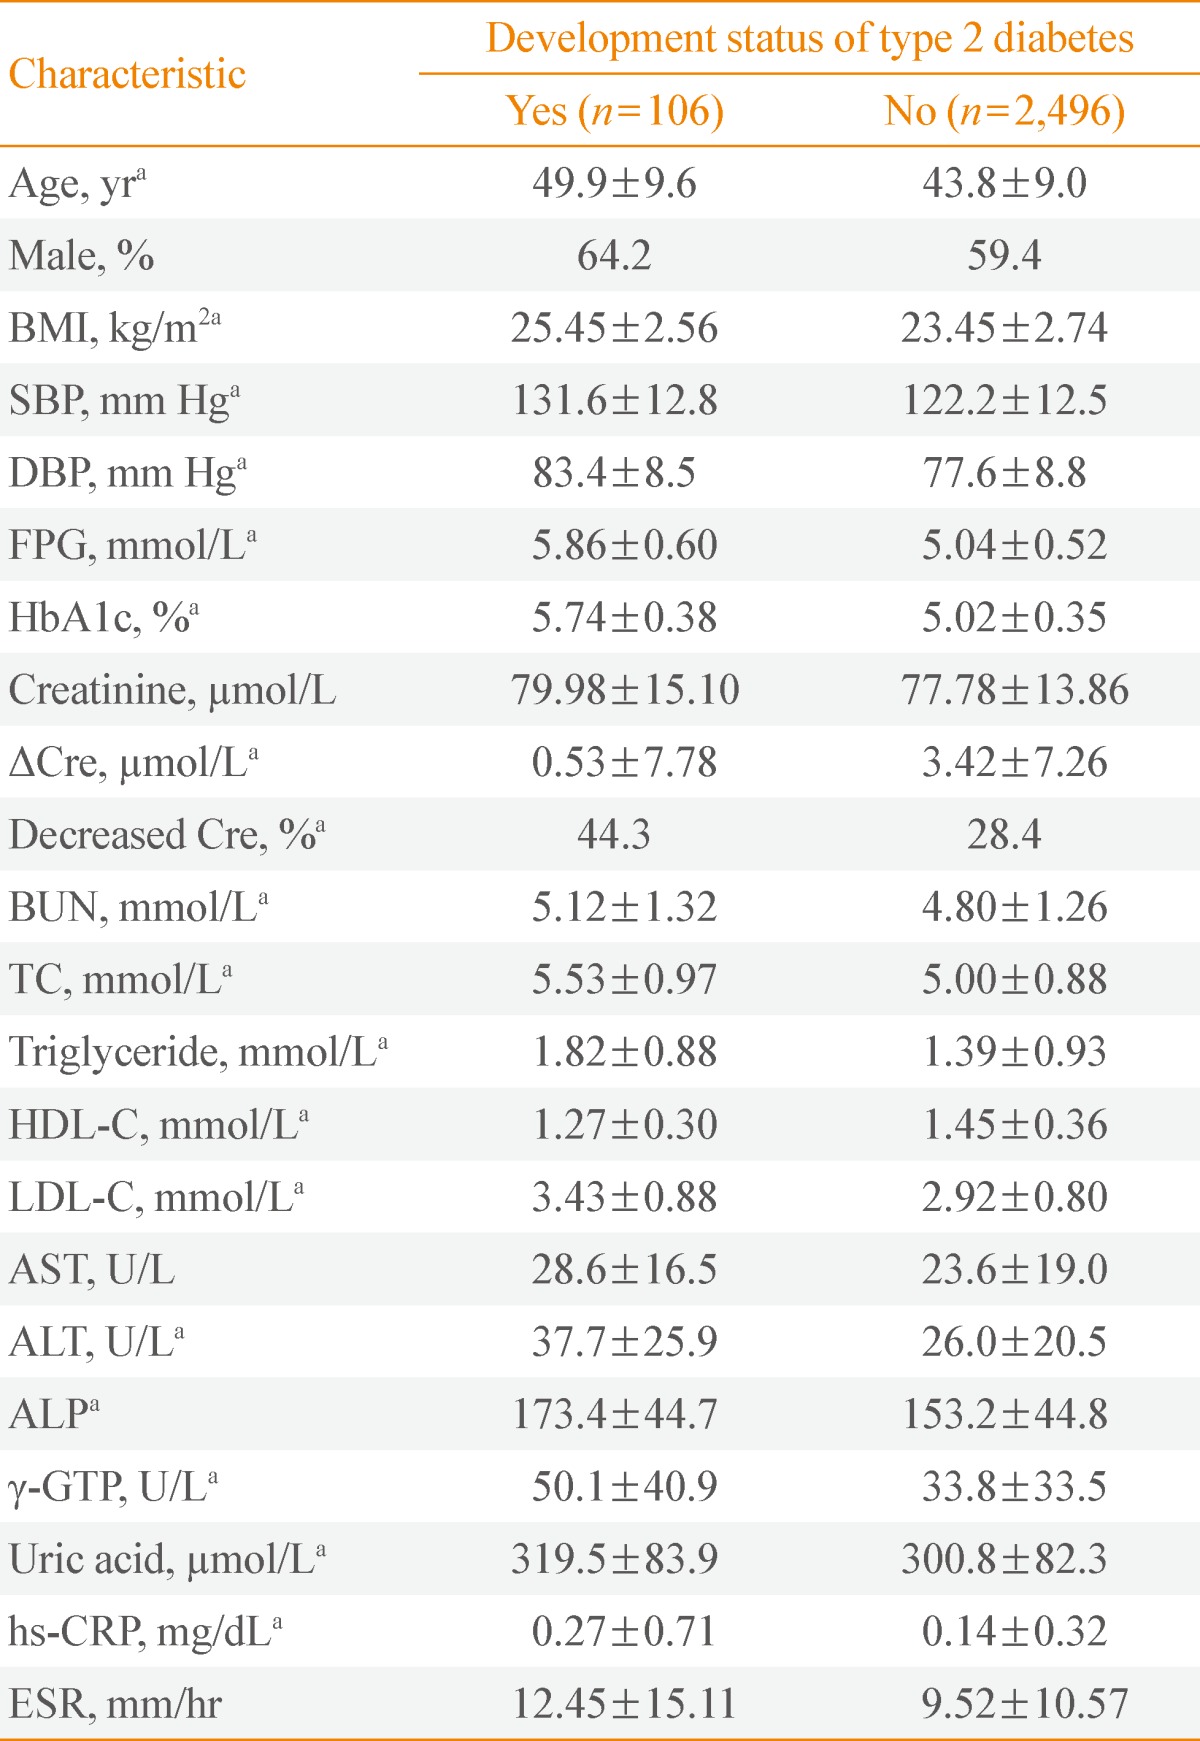
Table 1.
Characteristics according to Development Status of Type 2 Diabetes during Follow-Up

Values are expressed as mean±SD or number (%).
BMI, body mass index; SBP, systolic blood pressure; DBP, diastolic blood pressure; FPG, fasting plasma glucose level; HbA1c, glycated hemoglobin; ΔCre, follow-up serum creatinine level to baseline serum creatinine level; Decreased Cre, follow-up serum creatinine level to baseline serum creatinine level <0; BUN, blood urea nitrogen; TC, total cholesterol; HDL-C, high density lipoprotein cholesterol; LDL-C, low density lipoprotein cholesterol; AST, aspartate aminotransferase; ALT, alanine aminotransferase; ALP, alkaline phosphatase; γ-GTP, γ-glutamyl transpeptidase; hs-CRP, high-sensitivity C-reactive protein; ESR, erythrocyte sedimentation rate.
aP<0.05.
