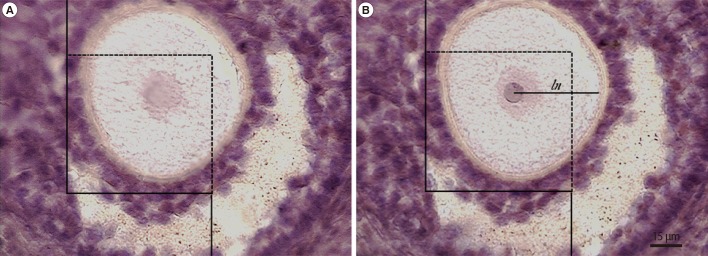
Figure 3.

The optical disector and nucleator methods. The numerical density of the cells was estimated using an unbiased counting frame, which was superimposed on the images. Just the cell whose nucleolus (oocyte) or nucleus (granulosa cell) did not appear in the beginning of the dissector height (A) but at the following optical scan (B) was counted. The cell whose nucleus was completely or partly inside the counting frame but only touched the upper and right lines was counted. The intercept length (ln) was measured for estimating the mean oocyte volume. Hematoxylin and eosin stain. Scale bar=15 µm.
