
Table 3.
Mean±SD of the mean volume (µm3) of the different oocytes, total volume (mm3) of the cyst and corpus luteum in the ovary of letrozole-, normal saline-, estradiol valerate-, and olive oil-treated groups
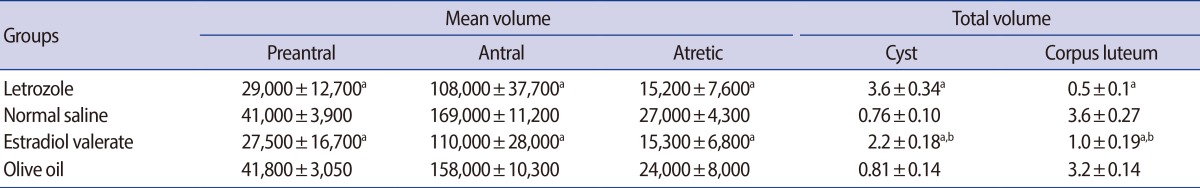
ap<0.001, letrozole vs. normal saline group, estradiol valerate vs. olive oil group; bp<0.01, letrozole vs. estradiol valerate.