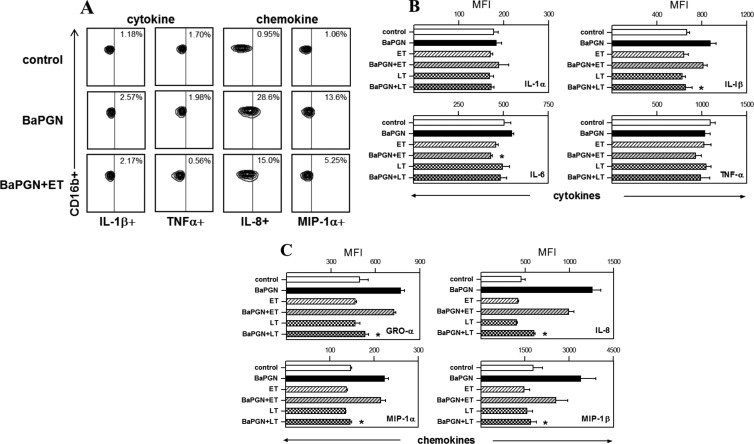
Fig 3.
Immunosuppressive effects of AT on BaPGN-treated human neutrophils. Fresh human WBCs were treated with BaPGN, ET, or LT alone or BaPGN plus ET or LT, as for Fig. 1, and then stained with antibodies to intracellular cytokines/chemokines and to cell surface markers: CD14 (monocytes), CD16b (neutrophils), CD19 (B lymphocytes), and CD3 (T lymphocytes). Cytokine/chemokine profiles for each cell type were then analyzed by flow cytometry. (A) Representative contour plots showing the staining intensities of cytokines (IL-1β and TNF-α) and chemokines (IL-8 and MIP-1α) in neutrophils. The numbers in the upper right corners indicate the percentages of cells in the samples that stained positive for the relevant cytokine or chemokine. (B and C) Intracellular levels of cytokines IL-1α, IL-1β, IL-6, and TNF-α (B) and chemokines GRO-α, IL-8, MIP-1α, and MIP-1β (C) in neutrophils, quantified as MFI. The data shown are the averages of three separate experiments, each using WBCs from a different donor. The error bars indicate SEM. The asterisks indicate a significant (P < 0.05) decrease compared to treatment with BaPGN alone.

