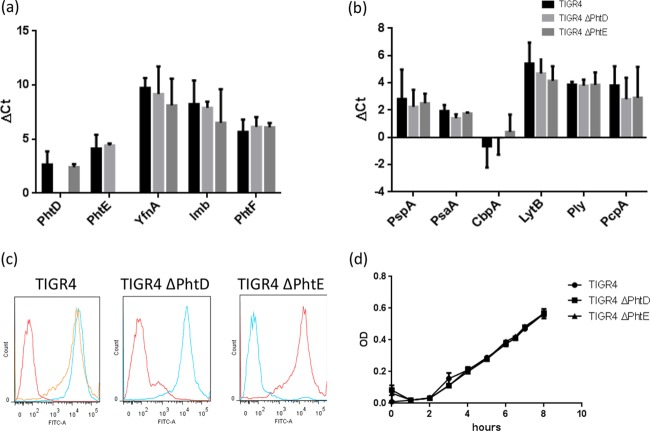
Fig 1.
Characterization of PhtD and PhtE mutants. (a, b) RNA was extracted from log-phase wild-type TIGR4, TIGR4 ΔPhtD, and TIGR4 ΔPhtE, and cDNA was subsequently synthesized. Real-time PCR was set up and GAPDH (glyceraldehyde-3-phosphate dehydrogenase), along with the genes of interest (the YfnA, Lmb, PhtD, PhtE, PhtF, PspA, PsaA, Ply, CbpA, LytB, and PcpA genes), was used as a housekeeping gene. Results are expressed as the mean and standard deviation of the change in the threshold cycle (ΔCT) from the changes in the threshold cycles for wild-type TIGR4, TIGR4 ΔPhtD, and TIGR4 ΔPhtE. One-way analysis of variance was used to find the significance in gene expression among TIGR4, TIGR4 ΔPhtD, and TIGR4 ΔPhtE (P > 0.05). (c) Log-phase bacteria (1 × 10⁷) from wild-type TIGR4, TIGR4 ΔPhtD, and TIGR4 ΔPhtE cultures were separately incubated with anti-PhtD and anti-PhtE antibodies for 1 h at 37°C. Bacteria were washed twice and incubated with anti-mouse FITC secondary antibody for 30 min at 37°C. Stained bacteria were read on an LSR II flow cytometer by acquiring 20,000 events. Data were analyzed by FlowJo software (Tree Star). The first histogram of the panel represents wild-type TIGR4 unstained and stained with anti-PhtD and anti-PhtE monoclonal antibodies (geometric mean fluorescence intensities, 85, 3,412, and 3,127); the second histogram (geometric mean fluorescence intensities, 213 and 3,217) and the third histogram (geometric mean fluorescence intensities, 200 and 3,370) represent TIGR4 ΔPhtD and TIGR4 ΔPhtE, respectively, stained with anti-PhtD and anti-PhtE antibodies. (d) Wild-type TIGR4, TIGR4 ΔPhtD, and TIGR4 ΔPhtE were grown overnight at 37°C in a humidified CO2 incubator. On the next morning, cultures were reinoculated 1:100 in fresh medium and allowed to grow further. The growth kinetics of all three cultures was established by assessing the ODs at periodic intervals. Data represent the means and standard deviations of the ODs of 2 separate experiments. One-way analysis of variance was used to find the significance among TIGR4, TIGR4 ΔPhtD, and TIGR4 ΔPhtE (P > 0.05).

