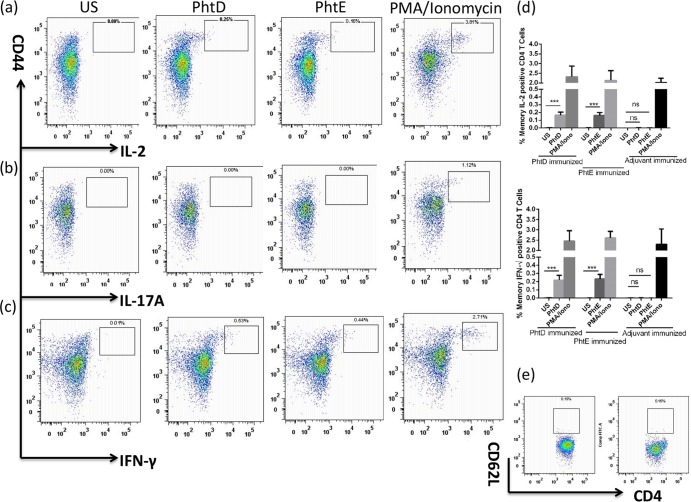
Fig 7.
Evaluation of the antigen-specific CD4 T cell response in PhtD- and PhtE-immunized mice. Mice were intranasally immunized with PhtD plus adjuvant, PhtE plus adjuvant, or adjuvant alone (5 mice per group), with two boosters given on days 14 and 28. One week after the second booster, antigen-specific CD4 T cell responses were evaluated in spleens by intracellular cytokine staining by using an 8-color panel. Mice were euthanized, their spleens were taken out and processed, and a single-cell suspension was prepared. One million splenocytes were used for stimulation with either PhtD, PhtE, or PMA-ionomycin (positive control). Data represent the means of 3 separate experiments with standard deviations. (a to c) Dot plot representation of cytokine-producing CD44hi CD4 T cells for IL-2 (a), IL-17A (b), and IFN-γ (c). The PhtD and PhtE dot plots were derived from splenocytes from mice immunized with PhtD and PhtE, respectively. The PMA-ionomycin dot plots were derived from mice immunized with PhtD. (d) Antigen-specific IFN-γ- and IL-2-producing CD4 T cell frequencies in mice immunized with PhtD plus adjuvant, PhtE plus adjuvant, and adjuvant only (control). The bars represent the mean (standard deviation) percent frequency of antigen-specific cytokine-producing cells as a percentage of total CD4+ cells. The Student t test was used for comparing antigen-stimulated cells with their respective unstimulated controls. ***, P < 0.001; ns, not significant (P > 0.2). (e) CD62L expression on ex vivo unstimulated CD4 T cells from PhtD-immunized (PhtD dot plot) and PhtE-immunized (PhtE dot plot) mice (e).

