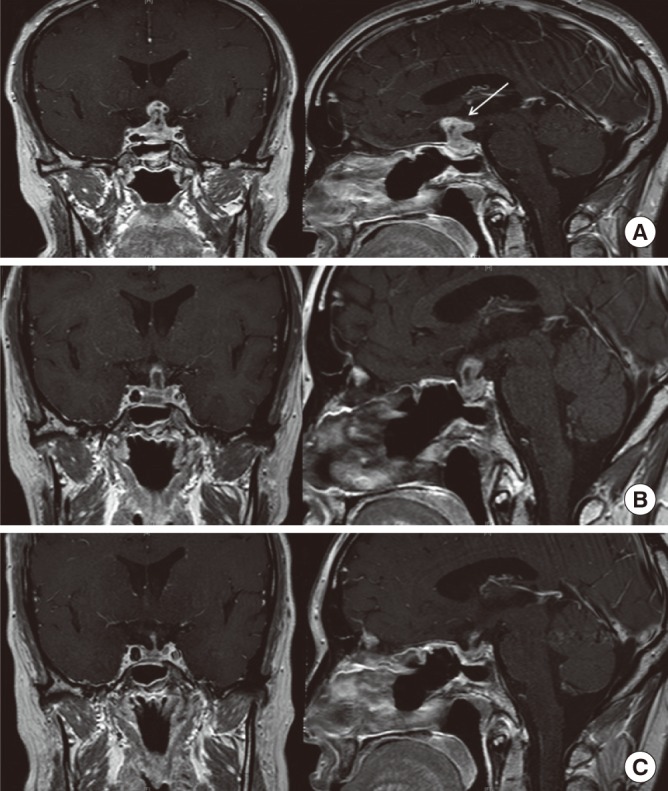
Fig. 3.

Magnetic resonance imaging (MRI) scan at prepost steroid pulse therapy, coronal (right), and sagittal (left) T1 weighted images. (A) At 10 months after surgery, MRI shows a significantly increasing mass (white arrow) infiltrating into the suprasellar area. (B) Four days after high dose steroid therapy, MRI shows decreased extent of mass at the suprasella area. (C) Three months after steroid therapy, MRI displays marked mass reduction at the sella and suprasella area.
