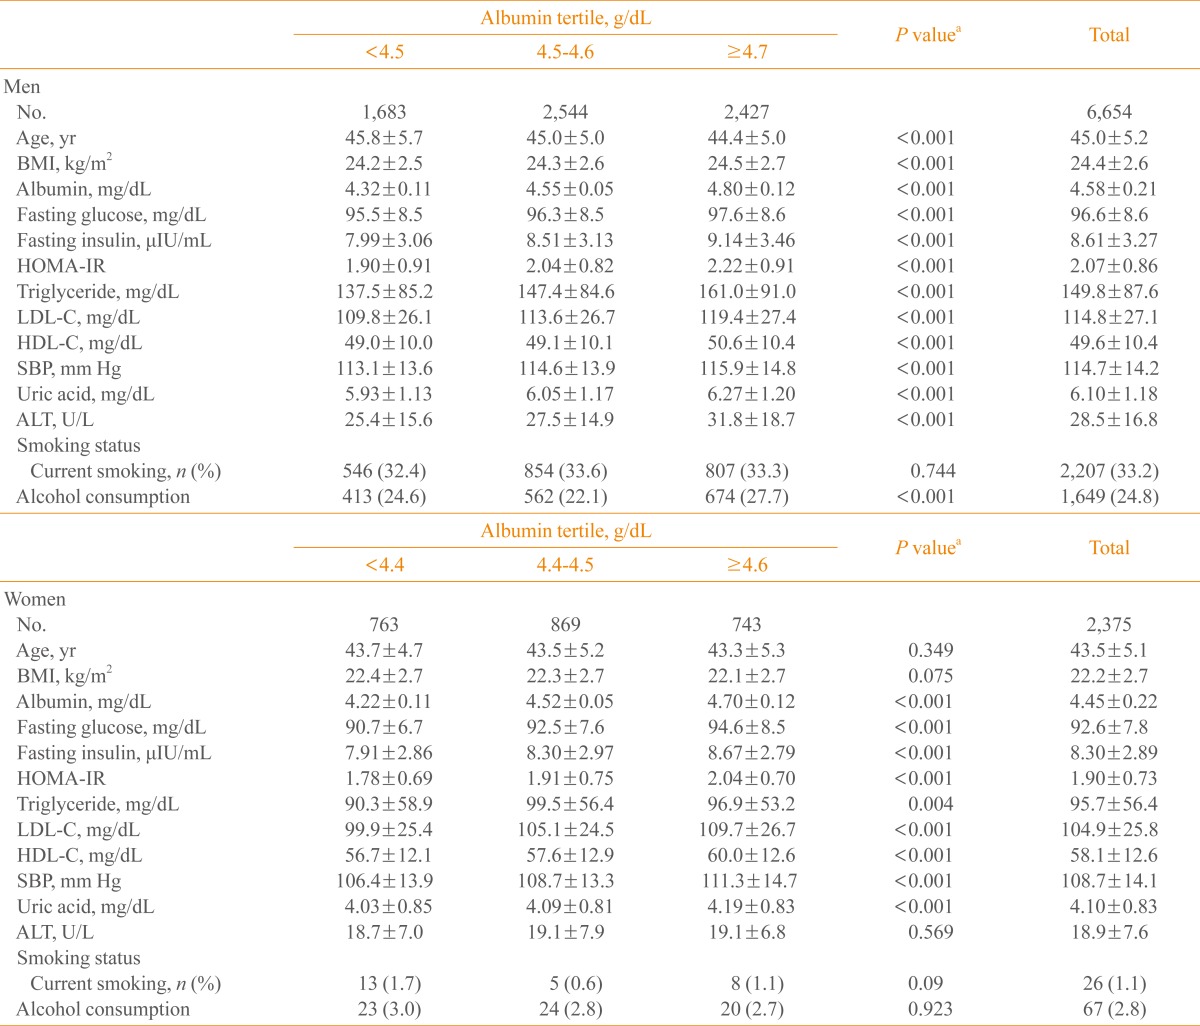
Table 1.
Baseline Characteristics

Values are expressed as mean±SD.
BMI, body mass index; HOMA-IR, homeostasis model assessment of insulin resistance; LDL-C, low density lipoprotein cholesterol; HDL-C, high density lipoprotein cholesterol; SBP, systolic blood pressure; ALT, alanine aminotransferase.
aBy one way analysis of variance.
