
Fig 5.
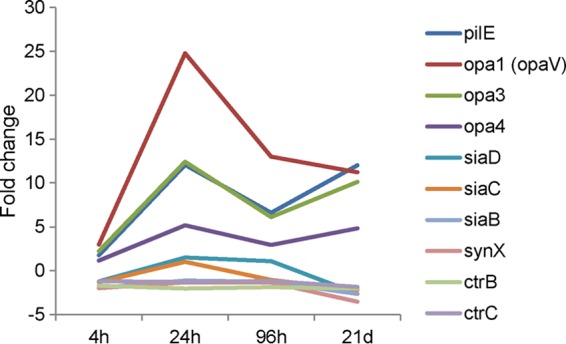
Transcriptional profiles of selected genes. Levels of meningococcal gene expression at different cocultivation time points (as indicated on the x axis) and for DMEM at 3 h were compared and are expressed as fold changes.
Official websites use .gov
A
.gov website belongs to an official
government organization in the United States.
Secure .gov websites use HTTPS
A lock (
) or https:// means you've safely
connected to the .gov website. Share sensitive
information only on official, secure websites.
Transcriptional profiles of selected genes. Levels of meningococcal gene expression at different cocultivation time points (as indicated on the x axis) and for DMEM at 3 h were compared and are expressed as fold changes.