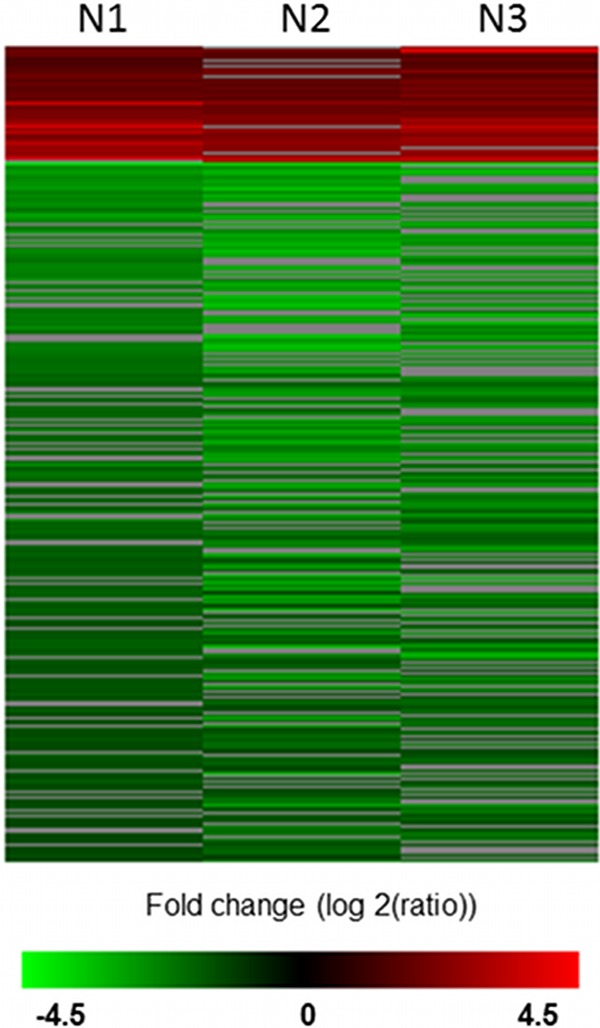
Fig 1.

Heat map of genes differentially expressed by meningothelial cells after contact with meningococci. Data from 3 independent experiments (N1, N2, and N3) were filtered and ratio normalized using the global Loess method and scale normalized using J-Express Pro. Genes were then selected using the SAM method with a 0% FDR. Clustering showed 43 upregulated (red) and 263 downregulated (green) genes.
